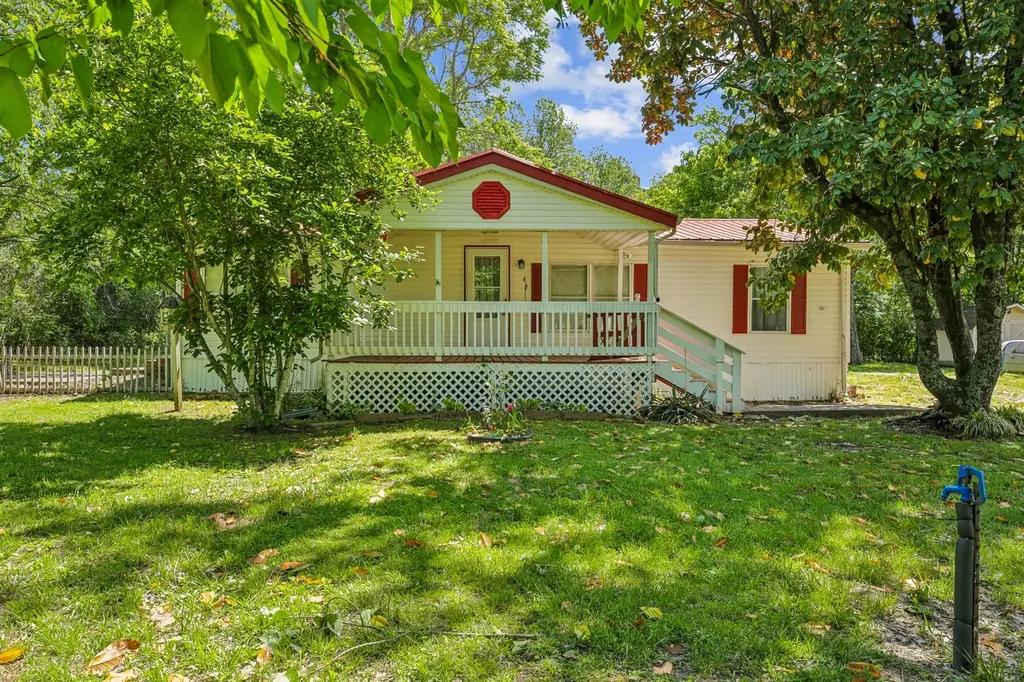
3212 Greer Rd
Nashville-Davidson metropolitan government (balance), TN 37072
$259,000D-
3 bd · 2.0 ba ·
1,188 sqft ·
Built 1996
· Manufactured
· Active
· 51 DOM
Cashflow @ list (25.0% down · 7.5%)
Estimated rent
$2,045/mo
Mortgage (P&I)
−$1,358
Tax + insurance
−$194
HOA
−$0
Vac / Maint / Mgmt
−$429
Net cashflow
$63/mo
Annual
$762/yr
Cap rate
6.59%
Cash-on-cash
1.05%
DSCR
1.05
1% rule
0.79%
Cash to close
$72,520
Investor read
- This is a 3-bed/2.0-bath manufactured listed at $259k.
- At list price, monthly cash flow is $63 ($762/yr) — positive.
- The deal already cash-flows at list — no discount required.
- To meet the 1% rule (rent ≥ 1% of price), the offer needs to be $204k (21.1% below list).
- It's been on market 51 days — a 3% lower offer ($251k) is reasonable based on typical stale-listing flexibility.
- Recommended offer: $204k (21.1% below list) — sets the bar for 1% rule.
- Local home prices are declining (-3.0%/yr); year-one equity from $2k of loan paydown is wiped out by about $8k of value loss. Plan a longer hold.
- Location reads: area grade D — affects rentability + tenant quality, not the cash-flow math above.
- Davidson County (urban): math 12% / reading 19% proficiency, ranked #126 of 139 in TN (top 91%) — low school quality limits family demand, transient renter base, plan for 1-2y turnover; 66% free/reduced lunch — lower-income household profile, screen leases tightly.
- Zoned schools: Joelton Elementary (math 22% / reading 27%, grade F, #546 of 952 statewide, top 61%, 264 students, 0% FRL); Whites Creek High (math 2% / reading 12%, grade F, #294 of 332 statewide, top 91%, 587 students, 0% FRL) — zoned schools average 0% FRL vs 66% district-wide (66 pts lower); this property's tenant base skews higher-income than the district average.
- Market conditions: Rents rising fast (+4.2%/yr); 242 active listings in the ZIP; solid renter incomes; 6,873 units permitted in Davidson County in 2024 (4,138 in 5+ unit buildings).
- Davidson County population projected at +42% by 2050 — long-run rental-demand tailwind backs the buy-and-hold thesis.
- 2 sale attempts with the ask held roughly flat each time — persistent listings suggest the price (not the market) is what's stuck; bring a comps-based counter.
- Current owner paid $66k; list at $259k implies a 292% gain — meaningful room to come down on a strong offer.
- Cap rate 6.6% vs local median 2.9% in Nashville-Davidson metropolitan government (balance) — top-decile yield for the area; either an underpriced asset or a hidden risk that comps aren't pricing in. Stress-test before assuming the spread holds.
- This rent runs 31% of the median local income ($78k/yr) — at the standard rent-burdened threshold; future hikes will face affordability resistance.
Questions for listing agent
- It's been on market 51 days. Have you received any prior offers? Is the seller open to a 21% concession, seller financing, or rate buy-down credit?
- Is there a deadline driving the sale (1031 exchange, divorce, estate, relocation)? That informs how much negotiation room exists.
- The area grade is low — what's the realistic commute time and amenity access for the typical tenant pool here? Any planned neighborhood developments (good or bad) we should know about?
- What's the average days-on-market for RENTAL listings here right now (not sales)? A rising rental-DOM trend means longer vacancies and softer asking-rent achievability than the comps imply.
- What's the recent tenant-quality profile in this submarket — average credit score on applications, eviction rate, late-payment / NSF rate, and stable-employment percentage? A property-management company in the area should have these aggregated.
- How much new for-sale + rental construction is in the pipeline within 1–3 miles? Heavy new supply typically softens prices + rents 12–24 months out; constrained supply supports both.
CashFlowRE · CFR-5QQN68FKP40TRJ
· Data 13 h ago
cashflowre.app · 2026-05-29