3212 Greer Rd · Nashville-Davidson metropolitan government (balance), TN
Flood risk 1/10 · Minimal
- FEMA flood zone
- X (unshaded)
- Chance of flooding over 30 yrs
- 0.0%
- Est. flood insurance / yr
- $507 – $1,088
Fire risk 4/10 · Minor
- Est. fire insurance / yr
- $949 – $1,763
Heat risk 4/10 · Minor
- Hot days now (above 106°F)
- 7 days/yr
- Hot days in 30 yrs
- 20 days/yr
Wind risk 4/10 · Minor
- Chance of severe wind over 30 yrs
- 8.0%
Air-quality risk 2/10 · Minimal
- Unhealthy air days now
- 0 days/yr
- Unhealthy air days in 30 yrs
- 1 days/yr
Risk factors via First Street. Map © Google.
Why this score? — see what drove the D- grade
The composite is a weighted blend of 9 inputs, each scored 0–100. Each bar is that input's sub-score; the figure is the points it added to the 100-point composite (weight × sub-score).
- Cash flow +14.6/30.0
- ARV discount +7.5/15.0
- DSCR +4.5/10.0
- Rent growth +3.5/5.0
- 1% rule +2.9/10.0
- Livability +2.5/5.0
- Condition / age +2.5/5.0
- Schools +1.4/10.0
- Appreciation +0.0/10.0
$259,000
🖨 Deal sheet (PDF) 📄 Offer letter ✓ Due diligence
Listing remarks
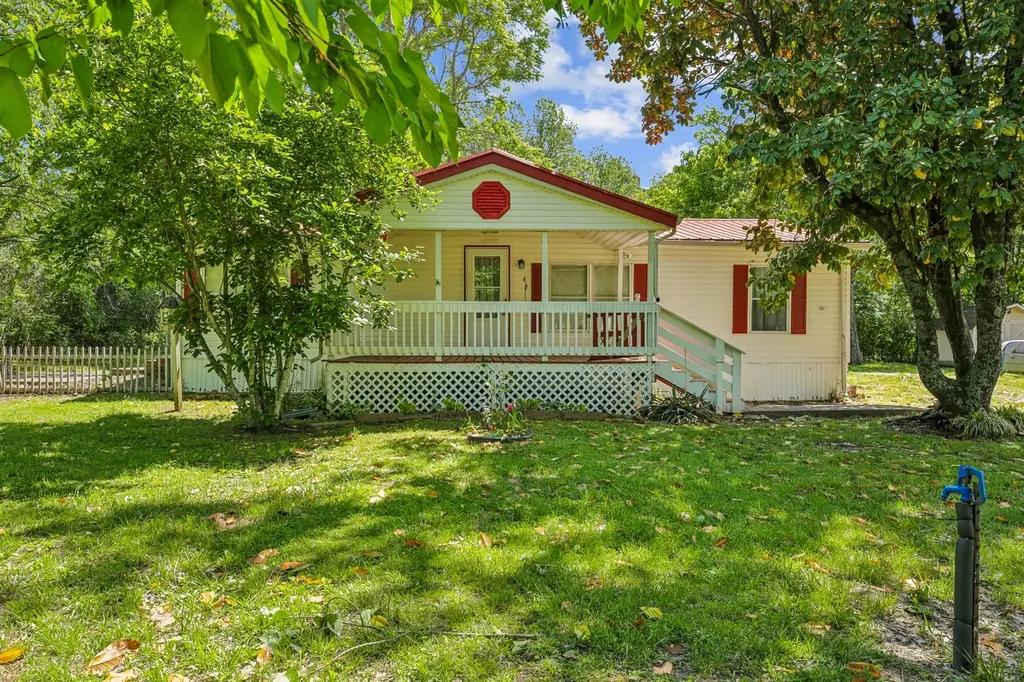
Discover the perfect opportunity to build or renovate on this beautiful 2.5-acre property in the heart of Goodlettsville. The property includes a double-wide manufactured home that needs work or can be removed, giving you the flexibility to start fresh or restore. A new 3-bedroom septic system, fill lines, and a new water line were installed in 2025. Electric, water, and driveway access are already in place, making it ready for your new home or investment project. Enjoy the privacy and peaceful setting of country living just minutes from restaurants, shopping, and easy access to I-65. Whether you’re looking for a homesite, renovation project, or land with full utilities ready to go,
Key facts
- New water line
- New septic system
- Driveway access
Tags
Property features AI
Finance
- HOA & community: Pets allowed
Exterior
- Parking: Driveway
- Utilities: Public water available; Septic tank; Water available to property
- Home design: Manufactured-on-land residential home; One story
- Construction: Vinyl siding; Metal roof; Existing structure
- Exterior features: Covered porch; Level lot; Storage structure on property
Interior
- Kitchen: Kitchen approximately 17x13; No appliances included
- Bedrooms: Three bedrooms total (all on the main level); Bedroom sizes approximately 12x14, 12x11, and 10x10
- Flooring: Carpet; Tile; Vinyl
- Bathrooms: Two full bathrooms
- Heating & cooling: Central heating; Central air conditioning
- Interior features: Den with fireplace; Crawl space basement
- Laundry & utility: Washer hookup and electric dryer hookup
Neighborhood map
What this means for you Summary
Snapshot
- This is a 3-bed/2.0-bath manufactured listed at $259k.
Deal economics
- At list price, monthly cash flow is $63 ($762/yr) — positive.
- The deal already cash-flows at list — no discount required.
- To meet the 1% rule (rent ≥ 1% of price), the offer needs to be $204k (21.1% below list).
- Recommended offer: $204k (21.1% below list) — sets the bar for 1% rule.
- Cap rate 6.6% vs local median 2.9% in Nashville-Davidson metropolitan government (balance) — top-decile yield for the area; either an underpriced asset or a hidden risk that comps aren't pricing in. Stress-test before assuming the spread holds.
Location & tenants
- Location reads: area grade D — affects rentability + tenant quality, not the cash-flow math above.
- Davidson County (urban): math 12% / reading 19% proficiency, ranked #126 of 139 in TN (top 91%) — low school quality limits family demand, transient renter base, plan for 1-2y turnover; 66% free/reduced lunch — lower-income household profile, screen leases tightly.
- Zoned schools: Joelton Elementary (math 22% / reading 27%, grade F, #546 of 952 statewide, top 61%, 264 students, 0% FRL); Whites Creek High (math 2% / reading 12%, grade F, #294 of 332 statewide, top 91%, 587 students, 0% FRL) — zoned schools average 0% FRL vs 66% district-wide (66 pts lower); this property's tenant base skews higher-income than the district average.
- Market conditions: Rents rising fast (+4.2%/yr); 240 active listings in the ZIP; solid renter incomes; 6,873 units permitted in Davidson County in 2024 (4,138 in 5+ unit buildings).
- This rent runs 31% of the median local income ($78k/yr) — at the standard rent-burdened threshold; future hikes will face affordability resistance.
Forward outlook
- Local home prices are declining (-3.0%/yr); year-one equity from $2k of loan paydown is wiped out by about $8k of value loss. Plan a longer hold.
- Davidson County population projected at +42% by 2050 — long-run rental-demand tailwind backs the buy-and-hold thesis.
Negotiation context
- It's been on market 51 days — a 3% lower offer ($251k) is reasonable based on typical stale-listing flexibility.
- 2 sale attempts with the ask held roughly flat each time — persistent listings suggest the price (not the market) is what's stuck; bring a comps-based counter.
- Current owner paid $66k; list at $259k implies a 292% gain — meaningful room to come down on a strong offer.
Questions for the listing agent
- It's been on market 51 days. Have you received any prior offers? Is the seller open to a 21% concession, seller financing, or rate buy-down credit?
- Is there a deadline driving the sale (1031 exchange, divorce, estate, relocation)? That informs how much negotiation room exists.
- The area grade is low — what's the realistic commute time and amenity access for the typical tenant pool here? Any planned neighborhood developments (good or bad) we should know about?
- What's the average days-on-market for RENTAL listings here right now (not sales)? A rising rental-DOM trend means longer vacancies and softer asking-rent achievability than the comps imply.
- What's the recent tenant-quality profile in this submarket — average credit score on applications, eviction rate, late-payment / NSF rate, and stable-employment percentage? A property-management company in the area should have these aggregated.
- How much new for-sale + rental construction is in the pipeline within 1–3 miles? Heavy new supply typically softens prices + rents 12–24 months out; constrained supply supports both.
Investment metrics
- 1% rule
- 0.79% ✗
- Cap rate
- 6.59%
- Cash-on-cash
- 1.05%
- DSCR
- 1.05
- GRM
- 10.6
CMA / ARV
No comps found within radius.
Projected returns pro-forma
-3.0% appreciation · 4.17% rent growth · sell at horizon
- IRR
- -13.5%
- Equity multiple
- 0.51×
- Total profit
- $-35,607
- Equity at exit
- $38,618
- IRR
- -3.2%
- Equity multiple
- 0.78×
- Total profit
- $-16,036
- Equity at exit
- $22,394
Cash invested: $72,520 (down + closing). Projections, not guarantees.
Landlord ↔ Tenant lean methodology
- Overall (STATE)
- 87 Strongly Landlord-Friendly
- State Tennessee
- 87 Strongly Landlord-Friendly · R+13
- County
- — inherits STATE
- City
- — inherits STATE
ZIP-level market 37072
- Home prices YoY
- -27.9%
- Rents YoY
- 4.2%
- Active inventory
- 240
- Price-to-rent
- 10.6×
Monthly cashflow live
- Estimated rent
- $2,045 medium interval (Pro) →
- Mortgage (P&I)
- −$1,358
- Tax from tax record
- −$86 /mo · $1,028/yr
- Insurance
- −$108
- HOA
- −$0
- Vacancy / Maint / Mgmt
- −$429
- Net cashflow
- $63
Break-even live
Sensitivity live
| Price | -10% $210 | -5% $137 | +0% $63 | +5% $-10 | +10% $-83 |
|---|---|---|---|---|---|
| Rent | -10% $-98 | -5% $-17 | +0% $63 | +5% $144 | +10% $225 |
| Rate | -1.0pp $194 | -0.5pp $129 | base $63 | +0.5pp $-4 | +1.0pp $-72 |
UW: 25.0% down · 7.5% · 30yr · 1.5% tax · 5.0% vac · 8.0% maint · 8.0% mgmt
Financing live
Cash to close
- Down payment
- $64,750
- Closing costs
- $7,770
- Reserves months
- —
- Total cash needed
- —
Loan-product check · same deal, 3 products live
Conventional
25% down · 7.5% · 30yr
- Down + closing
- —
- Monthly P&I
- —
- Monthly cashflow
- —
- DSCR
- —
- Eligible?
- —
Personal DTI + credit; lowest rate.
DSCR
20% down · 8.5% · 30yr
- Down + closing
- —
- Monthly P&I
- —
- Monthly cashflow
- —
- DSCR
- —
- Eligible?
- —
No personal income docs; deal must DSCR.
Hard money
10% down · 12.0% · 12mo
- Down + closing
- —
- Monthly P&I
- —
- Monthly cashflow
- —
- DSCR
- —
- Eligible?
- —
Short-term bridge; refi at stabilization.
Listing history 19 events
-
2026-06-21days on market $259,000 Active 51 DOM
-
2026-06-18days on market $259,000 Active 48 DOM
-
2026-06-17days on market $259,000 Active 47 DOM
-
2026-06-16days on market $259,000 Active 46 DOM
-
2026-06-15days on market $259,000 Active 45 DOM
-
2026-06-13days on market $259,000 Active 43 DOM
-
2026-06-13days on market $259,000 Active 42 DOM
-
2026-06-09days on market $259,000 Active 39 DOM
-
2026-06-08days on market $259,000 Active 38 DOM
-
2026-06-07days on market $259,000 Active 37 DOM
-
2026-06-05days on market $259,000 Active 34 DOM
-
2026-06-03days on market $259,000 Active 33 DOM
-
2026-06-02days on market $259,000 Active 32 DOM
-
2026-06-01days on market $259,000 Active 31 DOM
-
2026-05-31days on market $259,000 Active 30 DOM
-
2026-05-15status Active
-
2026-05-06historical Active Under Contract
-
2026-05-01$259,000 Active
-
2004-09-23soldstatus $66,000
ⓘ Source: listings_history table (triggers on properties + properties_extension) + one-shot
backfill from property_details.listing_events for pre-trigger history.
Tax reassessment forecast TN · Resets to sale price
- Current annual tax
- $1,028 · $86/mo
- Projected year-2 tax
- $1,839 · $153/mo
- Expected delta
- +$811/yr (+$68/mo · 78.9%)
ⓘ Screening estimate from a state-policy table — verify with the county assessor before closing.
Climate risk First Street
- Flood 1/10 Low FEMA zone X (unshaded) · 0% chance over 30 yrs
- Wildfire 4/10 Moderate
- Heat 4/10 Moderate 7 d/yr ≥106°F today · 20 d/yr by 30 yrs out
- Wind 4/10 Moderate 8% chance of damaging wind over 30 yrs
- Air quality 2/10 Low 0 unhealthy d/yr today · 1 by 30 yrs out
Nearby sold comps map
Loading sold comps map…
Walkable amenities ~0.75 mi
Loading nearby amenities…
Taxation est. · year 1
- Rental income
- $24,536
- − Mortgage interest
- −$14,508
- − Property taxes
- −$1,028
- − Insurance
- −$1,295
- − Repairs & maintenance
- −$1,963
- − Management
- −$1,963
- − Depreciation
- −$7,535
- Taxable loss
- −$3,755
- Est. tax savings @ 24.0%
- +$901
- After-tax cash flow
- $1,663/yr
For passive investors: Depreciation is non-cash, so a rental often shows a tax loss while cash-flowing — sheltering income. Rental losses are passive: they offset passive income freely, and up to $25,000/yr can offset ordinary (W-2) income if you actively participate and your MAGI is under $100k (phasing out to $0 by $150k); unused losses carry forward. On sale, claimed depreciation is recaptured at up to 25%, and gains may owe capital-gains tax (a 1031 exchange can defer both). Figures are a year-1 estimate at your 24.0% rate — not tax advice; consult a CPA.
Schools (NCES district)
- District
- Davidson County
- NCES district ID
- 4703180
- Math proficiency
- 12% ▼ -17.00%
- Reading proficiency
- 19% ▼ -7.00%
- Median HH income
- $48,667
- Composite
- 14.03/100
- National rank
- #9472
- State rank
- #126 of 139 in TN
Livability — Nashville-Davidson metropolitan government (balance)
No livability data for this city. (Only ~50 U.S. cities are tracked.)
Census & demographics
- Census place
- Nashville-Davidson metropolitan government (balance), TN
- County
- Sumner County · 196,654 people
- City population
- 677,595
- Metro
- Nashville-Davidson--Murfreesboro--Franklin, TN
- Population (ZIP)
- 32,208
- Household income
- $78,123
- Rent vs Own
- Severe rent burden
- 1013.0
Population outlook (Davidson County) Hauer SSP2
- Today (2025)
- 808,568 people
- By 2030
- 874,489 · +8.2%
- By 2040
- 1,009,046 · +24.8%
- By 2050
- 1,147,294 · +41.9%
- By 2075
- 1,475,439 · +82.5%
- By 2100
- 1,714,101 · +112.0%
Race, ethnicity, and origin ACS 2023
- Neighborhood character
- Diverse neighborhood (Simpson 0.55)
- Race & ethnicity
- White 64% Black 17% Hispanic / Latino 10% Two or more races 9% Asian 2%
- Hispanic origin (detail)
- Mexican 7% Puerto Rican 1%
- Common ancestry
- Italian 3% Slovak 2% Serbian 2%
- Foreign-born
- 6% · Canada
- Languages at home
- 91% English-only · Spanish 7% Other Indo-European 1% Other Asian/Pacific 1%
Political lean MEDSL · Davidson
- 2024 margin
- Strong D (+27.4) · D 62.7% · R 35.3% · Other 2.0%
- 2008→2024 swing
- +6.5pp toward D · 2008: 21.0pp · 2024: 27.4pp
- All cycles
- 2024: D+27.4 2020: D+32.1 2016: D+26.0 2012: D+18.7 2008: D+21.0
Not yet ingested
- Civics
- —
Market trends
- HPI YoY
- ▼ -110.17%
- Current HPI
- 284.0523
- Rent YoY
- ▲ 4.17%
- Metro
- Nashville-Davidson--Murfreesboro--Franklin, TN
- State GDP YoY
- ▲ 2.78%
- F500 in state
- 22
Industry mix (Fortune 500 HQ in TN)
| Industry | F500 HQs | Revenue |
|---|---|---|
| Healthcare | 3 | $91B |
|
||
| Retail | 3 | $72B |
|
||
| Transportation / Logistics | 1 | $88B |
|
||
| Paper / Packaging | 1 | $19B |
|
||
| Insurance | 1 | $13B |
|
||
| Energy | 1 | $12B |
|
||
Price history
+292.4% since first listed4 events — show timeline
- 2026-05-15 Relisted — REALTRACS as Distributed by MLS Grid
- 2026-05-06 Contingent — REALTRACS as Distributed by MLS Grid
- 2026-05-01 Listed $259,000 REALTRACS as Distributed by MLS Grid
- 2004-09-23 Sold (Public Records) $66,000 Public Records
Property tax history
+5.2%/yrLatest (2025): $1,028 · +82.8% YoY. Source: county tax records.
Cash-flow waterfall
monthlySold comps — $/sqft
last 12 mo · ≤1 miLoading sold comps…