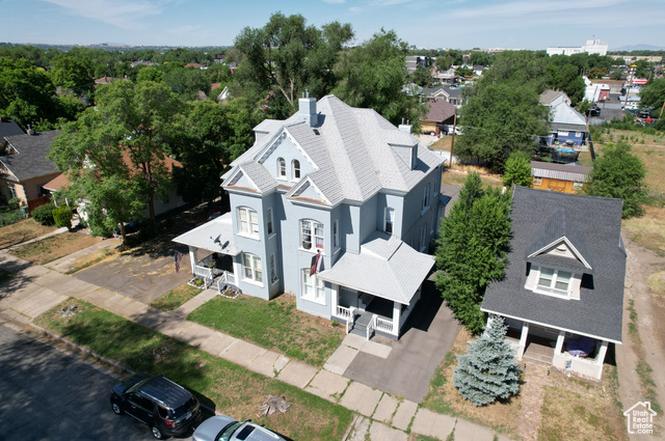
3027 Adams Ave Ave
Ogden, UT 84403
$1,400,000C+
120 bd · 100.0 ba ·
4,680 sqft ·
Built 1896
· MultiFamily
· Active
· 274 DOM
Cashflow @ list (25.0% down · 7.5%)
Estimated rent
$16,854/mo
Mortgage (P&I)
−$7,342
Tax + insurance
−$2,333
HOA
−$0
Vac / Maint / Mgmt
−$3,539
Net cashflow
$3,640/mo
Annual
$43,675/yr
Cap rate
9.41%
Cash-on-cash
11.14%
DSCR
1.50
1% rule
1.20%
Cash to close
$392,000
Investor read
- This is a 10 × 12-bed/10.0-bath units multifamily listed at $1.40M.
- At list price, monthly cash flow is $4k ($44k/yr) — positive. Per door: $364/mo.
- The deal already cash-flows at list — no discount required.
- Meets the 1% rule at list price ($17k rent vs $1.40M).
- It's been on market 274 days — a 12% lower offer ($1.23M) is reasonable based on typical stale-listing flexibility.
- Recommended offer: $1.23M (12.0% below list) — sets the bar for market timing.
- Local home prices are declining (-3.0%/yr); year-one equity from $10k of loan paydown is wiped out by about $42k of value loss. Plan a longer hold.
- Location reads 84/100 on livability (#19 in UT, #810 nationally) — a professional / high-income tenant draw. Strengths: amenities A+, commute A+, cost of living A+; Watch: crime F.
- Ogden City District (urban): math 25% / reading 31% proficiency, ranked #72 of 80 in UT (top 90%) — low school quality limits family demand, transient renter base, plan for 1-2y turnover; 75% free/reduced lunch — lower-income household profile, screen leases tightly.
- Zoned schools: Mount Ogden Junior High (math 33% / reading 38%, grade F, #94 of 138 statewide, top 68%, 858 students, 31% FRL); Ogden High (math 15% / reading 37%, grade F, #137 of 171 statewide, top 81%, 1,128 students, 35% FRL) — zoned schools average 33% FRL vs 75% district-wide (42 pts lower); this property's tenant base skews higher-income than the district average.
- Watch-outs: built in 1896 — expect roof / HVAC / electrical / plumbing capex.
- Market conditions: Rents rising (+1.9%/yr); 238 active listings in the ZIP; solid renter incomes; 1,630 units permitted in Weber County in 2024 (521 in 5+ unit buildings).
- Weber County population projected at +24% by 2050 — long-run rental-demand tailwind backs the buy-and-hold thesis.
- 9 sale attempts since 19y ago; this cycle's ask has dropped $195k (12%) from the opening price — seller is motivated, your offer sets the floor, not the list.
- At $16,854/mo this rent would consume 229% of the median local household income ($88k/yr) (locally 1076% of renters already pay >50% of income on rent) — very limited rent-growth headroom before tenants either downsize or default.
Questions for listing agent
- It's been on market 274 days. Have you received any prior offers? Is the seller open to a 12% concession, seller financing, or rate buy-down credit?
- Can we see the unit-by-unit rent roll, current vacancy, and any below-market leases? What's the average tenancy length?
- What capital expenditures (roof, boiler, parking lot, exteriors) have been made in the last 5 years, and what's planned in the next 2?
- Built in 1896 — when were the roof, HVAC, electrical panel, plumbing, and water heater last replaced?
- Why hasn't it sold? Are there any deal-killer items the seller is aware of (foundation, flood, title, zoning, code violations)?
- Is there a deadline driving the sale (1031 exchange, divorce, estate, relocation)? That informs how much negotiation room exists.
- Crime grade is F in this area — have there been break-ins, vandalism, or insurance claims at this property in the last 3 years? What carrier currently insures it and at what premium?
- What's the average days-on-market for RENTAL listings here right now (not sales)? A rising rental-DOM trend means longer vacancies and softer asking-rent achievability than the comps imply.
CashFlowRE · CFR-5SSXKPDM7E0JKF
· Data 2 days ago
cashflowre.app · 2026-05-29