 10-Plex
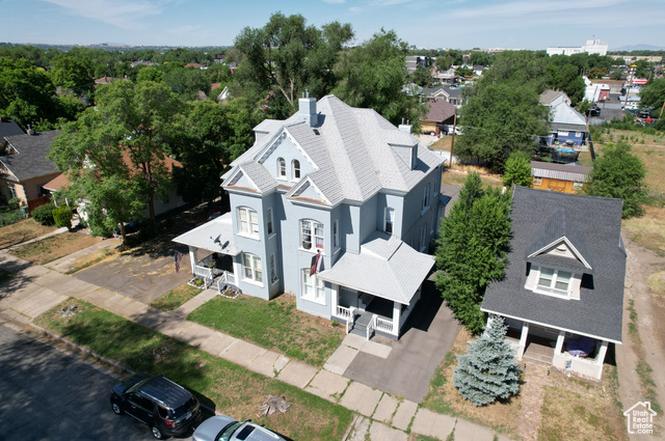
3027 Adams Ave Ave · Ogden, UT
Flood risk 3/10 · Minor
- FEMA flood zone
- X (unshaded)
- Chance of flooding over 30 yrs
- 0.2%
- Est. flood insurance / yr
- $507 – $1,088
Fire risk 1/10 · Minimal
- Est. fire insurance / yr
- $453 – $841
Heat risk 4/10 · Minor
- Hot days now (above 90°F)
- 7 days/yr
- Hot days in 30 yrs
- 20 days/yr
Wind risk 1/10 · Minimal
- Chance of severe wind over 30 yrs
- —
Air-quality risk 4/10 · Minor
- Unhealthy air days now
- 4 days/yr
- Unhealthy air days in 30 yrs
- 5 days/yr
Risk factors via First Street. Map © Google.
Why this score? — see what drove the C+ grade
The composite is a weighted blend of 9 inputs, each scored 0–100. Each bar is that input's sub-score; the figure is the points it added to the 100-point composite (weight × sub-score).
- Cash flow +26.4/30.0
- DSCR +9.0/10.0
- ARV discount +7.5/15.0
- 1% rule +7.0/10.0
- Livability +4.2/5.0
- Rent growth +3.0/5.0
- Condition / age +2.5/5.0
- Schools +2.4/10.0
- Appreciation +0.0/10.0
$1,400,000
🖨 Deal sheet 📄 Offer letter ✓ Due diligence
Multi-family units
County records classify this as Multi-Family (5+ Unit). Listing-text estimate: 10 units. confirmed
5+ unit building — per-unit beds/baths from public records are typically unavailable; the breakdown below (if shown) is an estimate from the listing text.
Listing remarks
Located in the heart of Ogden, 3027 Adams Avenue is a fully leased 10-unit Victorian-style property generating $9,300/ month in gross rent. Priced at $1,595,000, the asset offers a 5.6% in-place cap rate and features a mix of 6 studios, 2 one-bedrooms, and 2 two-bedrooms. Situated on a 0.40-acre lot with off-street parking, the property is within walking distance of downtown, transit, and Weber State University. With stable income, room for rent growth, and utility bill-back potential, this is a turn-key investment with upside in a growing market.
Key facts
- Turn-key investment
- Off-street parking
- 0.32 acre lot
Tags
Property features AI
Finance
- Other: Tax annual amount listed (see agent for details)
- Financial info: Property contains 10 total units; Unit mix and rents — six 1BR/1BA units at $795; two 2BR/1BA units at $950; two 2BR/1BA units at $1,100
Exterior
- Parking: Total of 12 parking spaces; 2 covered/garage spaces; 10 open/uncovered parking spaces
- Utilities: Natural gas connected; Electricity connected; Water (culinary) connected; Sewer connected
- Home design: Multi-family residential; 3-story building; Built/standing (constructed); Multi-family zoning
- Construction: Built in 2010; Brick construction; Asphalt pitched roof
- Exterior features: Double pane windows; Curb and gutter; Sidewalks; Mature trees; Flat terrain
Interior
- Kitchen: Range/oven included
- Bedrooms: Six 1-bedroom units; Four 2-bedroom units
- Flooring: Carpet; Linoleum
- Bathrooms: Ten 1-bath units
- Heating & cooling: Gas central heating
- Interior features: Free-standing range/oven; Blinds on full-size windows
- Laundry & utility: Utilities: Natural gas connected, electricity connected, water connected, sewer connected
Neighborhood map
What this means for you Summary
Snapshot
- This is a 10 × 12-bed/10.0-bath units multifamily listed at $1.40M.
Deal economics
- At list price, monthly cash flow is $4k ($44k/yr) — positive. Per door: $364/mo.
- The deal already cash-flows at list — no discount required.
- Meets the 1% rule at list price ($17k rent vs $1.40M).
- Recommended offer: $1.23M (12.0% below list) — sets the bar for market timing.
Location & tenants
- Location reads 84/100 on livability (#19 in UT, #810 nationally) — a professional / high-income tenant draw. Strengths: amenities A+, commute A+, cost of living A+; Watch: crime F.
- Ogden City District (urban): math 25% / reading 31% proficiency, ranked #72 of 80 in UT (top 90%) — low school quality limits family demand, transient renter base, plan for 1-2y turnover; 75% free/reduced lunch — lower-income household profile, screen leases tightly.
- Zoned schools: Mount Ogden Junior High (math 33% / reading 38%, grade F, #94 of 138 statewide, top 68%, 858 students, 31% FRL); Ogden High (math 15% / reading 37%, grade F, #137 of 171 statewide, top 81%, 1,128 students, 35% FRL) — zoned schools average 33% FRL vs 75% district-wide (42 pts lower); this property's tenant base skews higher-income than the district average.
- Market conditions: Rents rising (+1.9%/yr); 238 active listings in the ZIP; solid renter incomes; 1,630 units permitted in Weber County in 2024 (521 in 5+ unit buildings).
- At $16,854/mo this rent would consume 229% of the median local household income ($88k/yr) (locally 1076% of renters already pay >50% of income on rent) — very limited rent-growth headroom before tenants either downsize or default.
Forward outlook
- Local home prices are declining (-3.0%/yr); year-one equity from $10k of loan paydown is wiped out by about $42k of value loss. Plan a longer hold.
- Weber County population projected at +24% by 2050 — long-run rental-demand tailwind backs the buy-and-hold thesis.
Negotiation context
- It's been on market 274 days — a 12% lower offer ($1.23M) is reasonable based on typical stale-listing flexibility.
- 9 sale attempts since 19y ago; this cycle's ask has dropped $195k (12%) from the opening price — seller is motivated, your offer sets the floor, not the list.
Risks & watch-outs
- Watch-outs: built in 1896 — expect roof / HVAC / electrical / plumbing capex.
Questions for the listing agent
- It's been on market 274 days. Have you received any prior offers? Is the seller open to a 12% concession, seller financing, or rate buy-down credit?
- Can we see the unit-by-unit rent roll, current vacancy, and any below-market leases? What's the average tenancy length?
- What capital expenditures (roof, boiler, parking lot, exteriors) have been made in the last 5 years, and what's planned in the next 2?
- Built in 1896 — when were the roof, HVAC, electrical panel, plumbing, and water heater last replaced?
- Why hasn't it sold? Are there any deal-killer items the seller is aware of (foundation, flood, title, zoning, code violations)?
- Is there a deadline driving the sale (1031 exchange, divorce, estate, relocation)? That informs how much negotiation room exists.
- Crime grade is F in this area — have there been break-ins, vandalism, or insurance claims at this property in the last 3 years? What carrier currently insures it and at what premium?
- What's the average days-on-market for RENTAL listings here right now (not sales)? A rising rental-DOM trend means longer vacancies and softer asking-rent achievability than the comps imply.
- What's the recent tenant-quality profile in this submarket — average credit score on applications, eviction rate, late-payment / NSF rate, and stable-employment percentage? A property-management company in the area should have these aggregated.
- How much new apartment / multifamily construction is in the pipeline within 1–3 miles? Heavy new supply (>2% of stock underway) typically softens rents 12–24 months out; light construction supports rent growth.
Investment metrics
- 1% rule
- 1.20% ✓
- Cap rate
- 9.41%
- Cash-on-cash
- 11.14%
- DSCR
- 1.50
- GRM
- 6.9
CMA / ARV
No comps found within radius.
Projected returns pro-forma
-3.0% appreciation · 1.92% rent growth · sell at horizon
- IRR
- -0.9%
- Equity multiple
- 0.97×
- Total profit
- $-12,920
- Equity at exit
- $208,745
- IRR
- 7.6%
- Equity multiple
- 1.55×
- Total profit
- $215,514
- Equity at exit
- $121,046
Cash invested: $392,000 (down + closing). Projections, not guarantees.
Landlord ↔ Tenant lean methodology
- Overall (STATE)
- 86 Strongly Landlord-Friendly
- State Utah
- 86 Strongly Landlord-Friendly · R+15
- County
- — inherits STATE
- City
- — inherits STATE
ZIP-level market 84403
- Rents YoY
- 1.9%
- Active inventory
- 238
- Price-to-rent
- 69.2×
Monthly cashflow live
- Estimated rent
- $16,854 medium interval (Pro) →
- Mortgage (P&I)
- −$7,342
- Tax est. 1.5%
- −$1,750 /mo · $21,000/yr
- Insurance
- −$583
- HOA
- −$0
- Vacancy / Maint / Mgmt
- −$3,539
- Net cashflow
- $3,640
Break-even live
10-unit breakdown (identical units grouped — click to expand)
| Units | Beds | Baths | Est. rent |
|---|---|---|---|
| 10× units | 12 | 10 | $16,850 |
| #1 | 12 | 10 | $1,685 |
| #2 | 12 | 10 | $1,685 |
| #3 | 12 | 10 | $1,685 |
| #4 | 12 | 10 | $1,685 |
| #5 | 12 | 10 | $1,685 |
| #6 | 12 | 10 | $1,685 |
| #7 | 12 | 10 | $1,685 |
| #8 | 12 | 10 | $1,685 |
| #9 | 12 | 10 | $1,685 |
| #10 | 12 | 10 | $1,685 |
| Total (10 units) | $16,854 | ||
UW: 25.0% down · 7.5% · 30yr · 1.5% tax · 5.0% vac · 8.0% maint · 8.0% mgmt
Financing live
Cash to close
- Down payment
- $350,000
- Closing costs
- $42,000
- Reserves months
- —
- Total cash needed
- —
Loan-product check · same deal, 3 products live
Conventional
25% down · 7.5% · 30yr
- Down + closing
- —
- Monthly P&I
- —
- Monthly cashflow
- —
- DSCR
- —
- Eligible?
- —
Personal DTI + credit; lowest rate.
DSCR
20% down · 8.5% · 30yr
- Down + closing
- —
- Monthly P&I
- —
- Monthly cashflow
- —
- DSCR
- —
- Eligible?
- —
No personal income docs; deal must DSCR.
Hard money
10% down · 12.0% · 12mo
- Down + closing
- —
- Monthly P&I
- —
- Monthly cashflow
- —
- DSCR
- —
- Eligible?
- —
Short-term bridge; refi at stabilization.
Listing history 34 events
-
2026-06-18days on market $1,400,000 Active 274 DOM
-
2026-06-17days on market $1,400,000 Active 273 DOM
-
2026-06-16days on market $1,400,000 Active 272 DOM
-
2026-06-15days on market $1,400,000 Active 271 DOM
-
2026-06-14days on market $1,400,000 Active 269 DOM
-
2026-06-13days on market $1,400,000 Active 268 DOM
-
2026-06-10days on market $1,400,000 Active 266 DOM
-
2026-06-09days on market $1,400,000 Active 265 DOM
-
2026-06-08days on market $1,400,000 Active 264 DOM
-
2026-06-07days on market $1,400,000 Active 263 DOM
-
2026-06-05days on market $1,400,000 Active 260 DOM
-
2026-06-03days on market $1,400,000 Active 259 DOM
-
2026-06-02days on market $1,400,000 Active 258 DOM
-
2026-06-01days on market $1,400,000 Active 257 DOM
-
2026-05-31days on market $1,400,000 Active 256 DOM
-
2026-05-31days on market $1,400,000 Active 255 DOM
-
2026-03-26price $1,400,000
-
2025-09-17$1,595,000 Active
-
2025-03-24historical $795
-
2025-02-21$795
-
2021-10-25historical
-
2021-09-02$1,475,000 Active
-
2016-10-28historical
-
2016-05-08status Active
-
2016-05-06historical
-
2016-05-04$395,000 Active
-
2015-03-31historical
-
2014-10-10$399,900
-
2008-08-26soldstatus
-
2008-03-29$235,000
-
2008-01-16historical
-
2007-07-16$295,000
-
2007-04-02soldstatus
-
2007-03-01$225,000
ⓘ Source: listings_history table (triggers on properties + properties_extension) + one-shot
backfill from property_details.listing_events for pre-trigger history.
Climate risk First Street
- Flood 3/10 Moderate FEMA zone X (unshaded) · 20% chance over 30 yrs
- Wildfire 1/10 Low
- Heat 4/10 Moderate 7 d/yr ≥90°F today · 20 d/yr by 30 yrs out
- Wind 1/10 Low
- Air quality 4/10 Moderate 4 unhealthy d/yr today · 5 by 30 yrs out
Nearby sold comps map
Loading sold comps map…
Walkable amenities ~0.75 mi
Loading nearby amenities…
Taxation est. · year 1
- Rental income
- $202,248
- − Mortgage interest
- −$78,422
- − Property taxes
- −$21,000
- − Insurance
- −$7,000
- − Repairs & maintenance
- −$16,180
- − Management
- −$16,180
- − Depreciation
- −$40,727
- Taxable income
- $22,739
- Est. tax owed @ 24.0%
- −$5,457
- After-tax cash flow
- $38,217/yr
For passive investors: Depreciation is non-cash, so a rental often shows a tax loss while cash-flowing — sheltering income. Rental losses are passive: they offset passive income freely, and up to $25,000/yr can offset ordinary (W-2) income if you actively participate and your MAGI is under $100k (phasing out to $0 by $150k); unused losses carry forward. On sale, claimed depreciation is recaptured at up to 25%, and gains may owe capital-gains tax (a 1031 exchange can defer both). Figures are a year-1 estimate at your 24.0% rate — not tax advice; consult a CPA.
Schools (NCES district)
- District
- Ogden City District
- NCES district ID
- 4900720
- Math proficiency
- 25% ▼ -2.00%
- Reading proficiency
- 31% ▼ -5.00%
- Median HH income
- $41,974
- Composite
- 23.76/100
- National rank
- #7818
- State rank
- #72 of 80 in UT
Livability — Ogden
- Score
- 84/100
- State rank
- #19
- US rank
- #810
Category grades
Schools grade is shown separately in the Schools card above.
Census & demographics
- Census place
- Ogden, UT
- County
- Weber County · 260,557 people
- City population
- 152,611
- Metro
- Ogden-Clearfield, UT
- Population (ZIP)
- 37,721
- Household income
- $88,236
- Rent vs Own
- Severe rent burden
- 1076.0
Population outlook (Weber County) Hauer SSP2
- Today (2025)
- 274,329 people
- By 2030
- 288,577 · +5.2%
- By 2040
- 314,848 · +14.8%
- By 2050
- 338,710 · +23.5%
- By 2075
- 384,412 · +40.1%
- By 2100
- 409,305 · +49.2%
Race, ethnicity, and origin ACS 2023
- Neighborhood character
- Predominantly White (71%)
- Race & ethnicity
- White 71% Hispanic / Latino 21% Two or more races 10% Black 2% Asian 1%
- Hispanic origin (detail)
- Mexican 15%
- Common ancestry
- Italian 5% Slovak 4% Iranian 3%
- Foreign-born
- 8% · Canada, China
- Languages at home
- 83% English-only · Spanish 13% Chinese 1% Other Indo-European 1%
Political lean MEDSL · Weber
- 2024 margin
- Strong R (+23.5) · D 36.8% · R 60.3% · Other 2.9%
- 2008→2024 swing
- +4.1pp toward D · 2008: -27.6pp · 2024: -23.5pp
- All cycles
- 2024: R+23.5 2020: R+22.7 2016: R+20.0 2012: R+46.0 2008: R+27.6
Not yet ingested
- Civics
- —
Market trends
- HPI YoY
- ▼ -295.85%
- Current HPI
- 308.019
- Rent YoY
- ▲ 1.92%
- Metro
- Ogden-Clearfield, UT
- State GDP YoY
- ▲ 3.54%
- F500 in state
- 2
Industry mix (Fortune 500 HQ in UT)
| Industry | F500 HQs | Revenue |
|---|---|---|
| Financial Services | 1 | $3B |
|
||
Price history
+522.2% since first listed18 events — show timeline
- 2026-03-26 Price Changed $1,400,000 WFRMLS
- 2025-09-17 Listed $1,595,000 WFRMLS
- 2025-03-24 Rental Removed $795 RENT.
- 2025-02-21 Listed for Rent $795 RENT.
- 2021-10-25 Listing Removed — WFRMLS
- 2021-09-02 Listed $1,475,000 WFRMLS
- 2016-10-28 Listing Removed — WFRMLS
- 2016-05-08 Relisted — WFRMLS
- 2016-05-06 Listing Removed — WFRMLS
- 2016-05-04 Listed $395,000 WFRMLS
- 2015-03-31 Listing Removed — WFRMLS
- 2014-10-10 Listed $399,900 WFRMLS
- 2008-08-26 Sold (MLS) — WFRMLS
- 2008-03-29 Listed $235,000 WFRMLS
- 2008-01-16 Listing Removed — WFRMLS
- 2007-07-16 Listed $295,000 WFRMLS
- 2007-04-02 Sold (MLS) — WFRMLS
- 2007-03-01 Listed $225,000 WFRMLS
Cash-flow waterfall
monthlySold comps — $/sqft
last 12 mo · ≤1 miLoading sold comps…