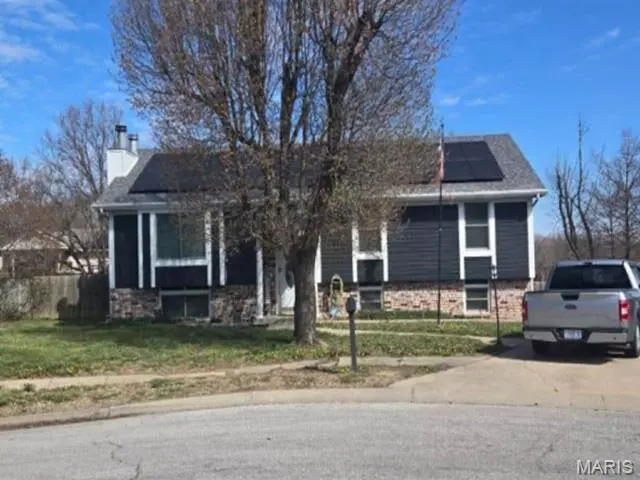
1232 N Sioux Ct
Independence, MO 64056
$206,800D+
3 bd · 2.0 ba ·
1,323 sqft ·
Built 1988
· SingleFamily
· Active
· 72 DOM
Cashflow @ list (25.0% down · 7.5%)
Estimated rent
$1,875/mo
Mortgage (P&I)
−$1,084
Tax + insurance
−$411
HOA
−$0
Vac / Maint / Mgmt
−$394
Net cashflow
$-14/mo
Annual
$-165/yr
Cap rate
6.21%
Cash-on-cash
-0.28%
DSCR
0.99
1% rule
0.91%
Cash to close
$57,904
Investor read
- This is a 3-bed/2.0-bath single-family listed at $207k.
- At list price, monthly cash flow is $-14 ($-165/yr) — negative.
- To cash-flow at today's rent, offer at most $204k (1.2% below list).
- To meet the 1% rule (rent ≥ 1% of price), the offer needs to be $188k (9.3% below list).
- It's been on market 72 days — a 6% lower offer ($194k) is reasonable based on typical stale-listing flexibility.
- Recommended offer: $188k (9.3% below list) — sets the bar for 1% rule.
- Local home prices are declining (-3.0%/yr); year-one equity from $1k of loan paydown is wiped out by about $6k of value loss. Plan a longer hold.
- Location reads 82/100 on livability (#10 in MO, #1,296 nationally) — a professional / high-income tenant draw. Strengths: amenities A+, commute A+, cost of living A+; Watch: schools C-, employment D+, crime F.
- Fort Osage R-I (rural): math 28% / reading 39% proficiency, ranked #213 of 324 in MO (top 66%) — families likely to look elsewhere, expect single-tenant / working-renter base with shorter leases.
- Market conditions: Rents rising (+3.8%/yr); 106 active listings in the ZIP; 9 comparable units currently listed for rent nearby; rentals leasing fast (median 4d on market — plan ~1-2 weeks tenant-placement turnaround); 4,002 units permitted in Jackson County in 2024 (2,271 in 5+ unit buildings).
- Jackson County population projected at +4% by 2050 — modest demand growth; plan on rents tracking national, not racing it.
- Cap rate 6.2% vs local median 5.0% in Independence — meaningfully above typical; check what's discounted (condition, days-on-market, listing class) to confirm the premium yield is real.
- This rent runs 33% of the median local income ($68k/yr) — at the standard rent-burdened threshold; future hikes will face affordability resistance.
Questions for listing agent
- What do current leases actually rent for vs. the listed asking? Can we see a recent rent roll and the last 12 months of T-12 income?
- It's been on market 72 days. Have you received any prior offers? Is the seller open to a 9% concession, seller financing, or rate buy-down credit?
- Why hasn't it sold? Are there any deal-killer items the seller is aware of (foundation, flood, title, zoning, code violations)?
- Is there a deadline driving the sale (1031 exchange, divorce, estate, relocation)? That informs how much negotiation room exists.
- Crime grade is F in this area — have there been break-ins, vandalism, or insurance claims at this property in the last 3 years? What carrier currently insures it and at what premium?
- The area grade is low — what's the realistic commute time and amenity access for the typical tenant pool here? Any planned neighborhood developments (good or bad) we should know about?
- What's the average days-on-market for RENTAL listings here right now (not sales)? A rising rental-DOM trend means longer vacancies and softer asking-rent achievability than the comps imply.
- What's the recent tenant-quality profile in this submarket — average credit score on applications, eviction rate, late-payment / NSF rate, and stable-employment percentage? A property-management company in the area should have these aggregated.
CashFlowRE · CFR-5VC259FES9106V
· Data 2 days ago
cashflowre.app · 2026-05-29