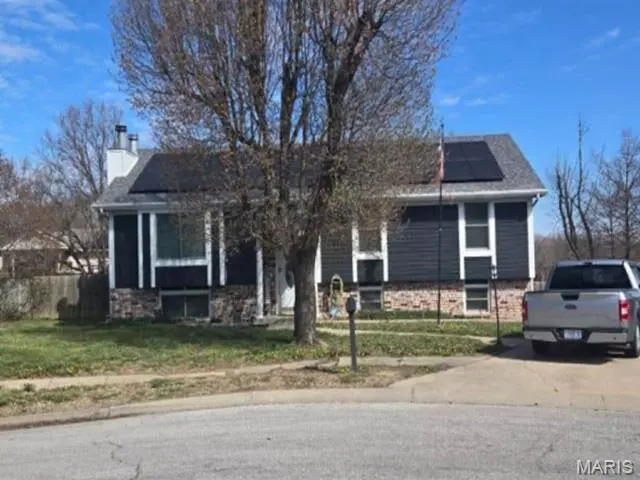
1232 N Sioux Ct · Independence, MO
Flood risk 1/10 · Minimal
- FEMA flood zone
- X (unshaded)
- Chance of flooding over 30 yrs
- 0.0%
- Est. flood insurance / yr
- $473 – $860
Fire risk 1/10 · Minimal
- Est. fire insurance / yr
- $1,054 – $1,958
Heat risk 4/10 · Minor
- Hot days now (above 107°F)
- 7 days/yr
- Hot days in 30 yrs
- 17 days/yr
Wind risk 2/10 · Minimal
- Chance of severe wind over 30 yrs
- —
Air-quality risk 4/10 · Minor
- Unhealthy air days now
- 4 days/yr
- Unhealthy air days in 30 yrs
- 5 days/yr
Risk factors via First Street. Map © Google.
Why this score? — see what drove the D+ grade
The composite is a weighted blend of 9 inputs, each scored 0–100. Each bar is that input's sub-score; the figure is the points it added to the 100-point composite (weight × sub-score).
- ARV discount +15.0/15.0
- Cash flow +12.9/30.0
- 1% rule +4.1/10.0
- Livability +4.1/5.0
- DSCR +3.9/10.0
- Rent growth +3.4/5.0
- Schools +3.0/10.0
- Condition / age +2.5/5.0
- Appreciation +0.0/10.0
$206,800
🖨 Deal sheet 📄 Offer letter ✓ Due diligence
Listing remarks MLS
This Split level home offers 3 bedrooms, and 2 bathrooms with approximately 1,323 square feet of living space. Built in 1988 this property features a functional layout with an unfinished basement providing opportunity for future expansion, storage, or additional living space. Auction Occupied – NO ACCESS OR VIEWINGS of this property. Please DO NOT DISTURB the occupant. "As is" CASH ONLY sale with no contingencies or inspections. Buyer will be responsible for obtaining possession of the property upon closing.
Key facts
- 0.48 acre lot
- 2 garage spots
- Built 1988
Neighborhood map
What this means for you Summary
Snapshot
- This is a 3-bed/2.0-bath single-family listed at $207k.
Deal economics
- At list price, monthly cash flow is $-14 ($-165/yr) — negative.
- To cash-flow at today's rent, offer at most $204k (1.2% below list).
- To meet the 1% rule (rent ≥ 1% of price), the offer needs to be $188k (9.3% below list).
- Recommended offer: $188k (9.3% below list) — sets the bar for 1% rule.
- Cap rate 6.2% vs local median 5.0% in Independence — meaningfully above typical; check what's discounted (condition, days-on-market, listing class) to confirm the premium yield is real.
Location & tenants
- Location reads 82/100 on livability (#10 in MO, #1,296 nationally) — a professional / high-income tenant draw. Strengths: amenities A+, commute A+, cost of living A+; Watch: schools C-, employment D+, crime F.
- Fort Osage R-I (rural): math 28% / reading 39% proficiency, ranked #213 of 324 in MO (top 66%) — families likely to look elsewhere, expect single-tenant / working-renter base with shorter leases.
- Market conditions: Rents rising (+3.8%/yr); 106 active listings in the ZIP; 9 comparable units currently listed for rent nearby; rentals leasing fast (median 4d on market — plan ~1-2 weeks tenant-placement turnaround); 4,002 units permitted in Jackson County in 2024 (2,271 in 5+ unit buildings).
- This rent runs 33% of the median local income ($68k/yr) — at the standard rent-burdened threshold; future hikes will face affordability resistance.
Forward outlook
- Local home prices are declining (-3.0%/yr); year-one equity from $1k of loan paydown is wiped out by about $6k of value loss. Plan a longer hold.
- Jackson County population projected at +4% by 2050 — modest demand growth; plan on rents tracking national, not racing it.
Negotiation context
- It's been on market 72 days — a 6% lower offer ($194k) is reasonable based on typical stale-listing flexibility.
Questions for the listing agent
- What do current leases actually rent for vs. the listed asking? Can we see a recent rent roll and the last 12 months of T-12 income?
- It's been on market 72 days. Have you received any prior offers? Is the seller open to a 9% concession, seller financing, or rate buy-down credit?
- Why hasn't it sold? Are there any deal-killer items the seller is aware of (foundation, flood, title, zoning, code violations)?
- Is there a deadline driving the sale (1031 exchange, divorce, estate, relocation)? That informs how much negotiation room exists.
- Crime grade is F in this area — have there been break-ins, vandalism, or insurance claims at this property in the last 3 years? What carrier currently insures it and at what premium?
- The area grade is low — what's the realistic commute time and amenity access for the typical tenant pool here? Any planned neighborhood developments (good or bad) we should know about?
- What's the average days-on-market for RENTAL listings here right now (not sales)? A rising rental-DOM trend means longer vacancies and softer asking-rent achievability than the comps imply.
- What's the recent tenant-quality profile in this submarket — average credit score on applications, eviction rate, late-payment / NSF rate, and stable-employment percentage? A property-management company in the area should have these aggregated.
- How much new for-sale + rental construction is in the pipeline within 1–3 miles? Heavy new supply typically softens prices + rents 12–24 months out; constrained supply supports both.
Investment metrics
- 1% rule
- 0.91% ✗
- Cap rate
- 6.21%
- Cash-on-cash
- -0.28%
- DSCR
- 0.99
- GRM
- 9.2
CMA / ARV
- ARV (median comp)
- $250,879
- List price
- $206,800
- Delta
- -17.57%
- Verdict
- UNDERPRICED
- Comps
- 20 within 1.0 mi
Show comp detail 12 sales within ~0.75 mi
| Address | Dist | Beds/Ba | Sqft | Sold | Price | $/sf | Match |
|---|---|---|---|---|---|---|---|
| 1607 N Belvidere Ave | 0.54mi | 3/1.0 | 1,314 (-1%) | 3mo | $160,000 | $122 | 67 |
| 1621 N Belvidere Ave | 0.57mi | 3/1.5 | 1,362 (+3%) | 1mo | $245,000 | $180 | 66 |
| 906 N Ponca Dr | 0.64mi | 3/1.5 | 1,362 (+3%) | 1mo | $225,000 | $165 | 62 |
| 816 N Tepee Dr | 0.57mi | 4/2.5 (+1) | 1,364 (+3%) | 1mo | $243,000 | $178 | 61 |
| 1600 N Dover St | 0.57mi | 3/2.0 | 1,216 (-8%) | 1mo | $250,000 | $206 | 59 |
| 18609 E Bundschu Pl | 0.62mi | 3/2.0 | 1,202 (-9%) | 2mo | $270,000 | $225 | 54 |
| 1413 N Geronimo Dr | 0.53mi | 4/2.0 (+1) | 1,450 (+10%) | 1mo | $185,000 | $128 | 54 |
| 658 N Mohican Dr | 0.71mi | 3/1.0 | 1,388 (+5%) | 4mo | $152,900 | $110 | 51 |
| 1422 N Blue Mills Rd | 0.69mi | 3/1.5 | 1,447 (+9%) | 3mo | $228,000 | $158 | 48 |
| 834 N Ponca Dr | 0.72mi | 3/1.5 | 1,200 (-9%) | 3mo | $219,900 | $183 | 47 |
| 1117 N Ponca Dr | 0.60mi | 3/3.0 | 1,492 (+13%) | 1mo | $245,000 | $164 | 46 |
| 1511 Osage Trl | 0.67mi | 3/1.0 | 1,150 (-13%) | 3mo | $174,900 | $152 | 40 |
Match score weights: distance 35% · size 25% · config 20% · recency 20%. Top-matched comps best support the ARV.
Projected returns pro-forma
-3.0% appreciation · 3.76% rent growth · sell at horizon
- IRR
- -15.8%
- Equity multiple
- 0.43×
- Total profit
- $-32,872
- Equity at exit
- $30,835
- IRR
- -6.1%
- Equity multiple
- 0.60×
- Total profit
- $-23,450
- Equity at exit
- $17,880
Cash invested: $57,904 (down + closing). Projections, not guarantees.
Landlord ↔ Tenant lean methodology
- Overall (STATE)
- 81 Strongly Landlord-Friendly
- State Missouri
- 81 Strongly Landlord-Friendly · R+10
- County
- — inherits STATE
- City
- — inherits STATE
ZIP-level market 64056
- Rents YoY
- 3.8%
- Active inventory
- 106
- Price-to-rent
- 9.2×
Monthly cashflow live
- Estimated rent
- $1,875 high interval (Pro) →
- Mortgage (P&I)
- −$1,084
- Tax from tax record
- −$325 /mo · $3,895/yr
- Insurance
- −$86
- HOA
- −$0
- Vacancy / Maint / Mgmt
- −$394
- Net cashflow
- $-14
Break-even live
UW: 25.0% down · 7.5% · 30yr · 1.5% tax · 5.0% vac · 8.0% maint · 8.0% mgmt
Financing live
Cash to close
- Down payment
- $51,700
- Closing costs
- $6,204
- Reserves months
- —
- Total cash needed
- —
Loan-product check · same deal, 3 products live
Conventional
25% down · 7.5% · 30yr
- Down + closing
- —
- Monthly P&I
- —
- Monthly cashflow
- —
- DSCR
- —
- Eligible?
- —
Personal DTI + credit; lowest rate.
DSCR
20% down · 8.5% · 30yr
- Down + closing
- —
- Monthly P&I
- —
- Monthly cashflow
- —
- DSCR
- —
- Eligible?
- —
No personal income docs; deal must DSCR.
Hard money
10% down · 12.0% · 12mo
- Down + closing
- —
- Monthly P&I
- —
- Monthly cashflow
- —
- DSCR
- —
- Eligible?
- —
Short-term bridge; refi at stabilization.
Rent comps 9 comps
| Address | Beds | Baths | Sqft | Rent | $/sqft | DOM | Units | Dist |
|---|---|---|---|---|---|---|---|---|
| 19246 E Ponca Dr Independence, MO | 3.0 | 1.5 | 1300 | $1,700 | $1.31 | 4d | 1 | 0.46mi |
| 19200 E Ponca Ter Independence, MO | 3.0 | 2.0 | 1195 | $1,973 | $1.65 | 43d | 1 | 0.48mi |
| 1604 N Glen Ellyn St Independence, MO | 3.0 | 2.0 | 1330 | $1,845 | $1.39 | 16d | 1 | 0.50mi |
| 18813 Lexington Rd Independence, MO | 2.0 | 1.5 | 1190 | $1,250 | $1.05 | 2d | 1 | 0.55mi |
| 1617 N Belvidere Ave Independence, MO | 3.0 | 2.0 | 1642 | $2,006 | $1.22 | 1d | 1 | 0.58mi |
| 1406 N Ponca Dr Independence, MO | 4.0 | 1.0 | 1400 | $1,650 | $1.18 | 4d | 1 | 0.62mi |
| 18410 E Shoshone Dr Independence, MO | 3.0 | 2.0 | 1426 | $1,450 | $1.02 | 43d | 1 | 0.70mi |
| 19300 E Salisbury Rd Independence, MO | 3.0 | 1.0 | 1257 | $1,845 | $1.47 | 1d | 1 | 0.96mi |
| 19200 E Salisbury Rd Independence, MO | 4.0 | 2.0 | 1518 | $2,000 | $1.32 | 23d | 1 | 0.96mi |
Listing history 17 events
-
2026-06-18days on market $206,800 Active 72 DOM
-
2026-06-17days on market $206,800 Active 71 DOM
-
2026-06-16days on market $206,800 Active 70 DOM
-
2026-06-15days on market $206,800 Active 69 DOM
-
2026-06-13pricedays on market $206,800 Active 67 DOM
-
2026-06-09days on market $213,800 Active 63 DOM
-
2026-06-08days on market $213,800 Active 62 DOM
-
2026-06-07days on market $213,800 Active 61 DOM
-
2026-06-03days on market $213,800 Active 57 DOM
-
2026-06-02days on market $213,800 Active 56 DOM
-
2026-06-01days on market $213,800 Active 55 DOM
-
2026-05-31days on market $213,800 Active 54 DOM
-
2026-05-08price $223,200 529-char remark
Show marketing remark (529 chars)
This Split level home offers 3 bedrooms, and 2 bathrooms with approximately 1,323 square feet of living space. Built in 1988 this property features a functional layout with an unfinished basement providing opportunity for future expansion, storage, or additional living space. Auction Occupied – NO ACCESS OR VIEWINGS of this property. Please DO NOT DISTURB the occupant. "As is" CASH ONLY sale with no contingencies or inspections. Buyer will be responsible for obtaining possession of the property upon closing.
-
2026-04-22price $235,000 529-char remark
Show marketing remark (529 chars)
This Split level home offers 3 bedrooms, and 2 bathrooms with approximately 1,323 square feet of living space. Built in 1988 this property features a functional layout with an unfinished basement providing opportunity for future expansion, storage, or additional living space. Auction Occupied – NO ACCESS OR VIEWINGS of this property. Please DO NOT DISTURB the occupant. "As is" CASH ONLY sale with no contingencies or inspections. Buyer will be responsible for obtaining possession of the property upon closing.
-
2026-04-07$249,100 Active 529-char remark
Show marketing remark (529 chars)
This Split level home offers 3 bedrooms, and 2 bathrooms with approximately 1,323 square feet of living space. Built in 1988 this property features a functional layout with an unfinished basement providing opportunity for future expansion, storage, or additional living space. Auction Occupied – NO ACCESS OR VIEWINGS of this property. Please DO NOT DISTURB the occupant. "As is" CASH ONLY sale with no contingencies or inspections. Buyer will be responsible for obtaining possession of the property upon closing.
-
2026-04-07historical $249,100 529-char remark
Show marketing remark (529 chars)
This Split level home offers 3 bedrooms, and 2 bathrooms with approximately 1,323 square feet of living space. Built in 1988 this property features a functional layout with an unfinished basement providing opportunity for future expansion, storage, or additional living space. Auction Occupied – NO ACCESS OR VIEWINGS of this property. Please DO NOT DISTURB the occupant. "As is" CASH ONLY sale with no contingencies or inspections. Buyer will be responsible for obtaining possession of the property upon closing.
-
1990-04-16soldstatus
ⓘ Source: listings_history table (triggers on properties + properties_extension) + one-shot
backfill from property_details.listing_events for pre-trigger history.
Tax reassessment forecast MO · Resets to sale price
- Current annual tax
- $3,895 · $325/mo
- Projected year-2 tax
- $3,895 · $325/mo
- Expected delta
- $0/yr ($0/mo · -0.0%)
ⓘ Screening estimate from a state-policy table — verify with the county assessor before closing.
Climate risk First Street
- Flood 1/10 Low FEMA zone X (unshaded) · 0% chance over 30 yrs
- Wildfire 1/10 Low
- Heat 4/10 Moderate 7 d/yr ≥107°F today · 17 d/yr by 30 yrs out
- Wind 2/10 Low
- Air quality 4/10 Moderate 4 unhealthy d/yr today · 5 by 30 yrs out
Nearby sold comps map
Loading sold comps map…
Walkable amenities ~0.75 mi
Loading nearby amenities…
Taxation est. · year 1
- Rental income
- $22,504
- − Mortgage interest
- −$11,584
- − Property taxes
- −$3,895
- − Insurance
- −$1,034
- − Repairs & maintenance
- −$1,800
- − Management
- −$1,800
- − Depreciation
- −$6,016
- Taxable loss
- −$3,626
- Est. tax savings @ 24.0%
- +$870
- After-tax cash flow
- $705/yr
For passive investors: Depreciation is non-cash, so a rental often shows a tax loss while cash-flowing — sheltering income. Rental losses are passive: they offset passive income freely, and up to $25,000/yr can offset ordinary (W-2) income if you actively participate and your MAGI is under $100k (phasing out to $0 by $150k); unused losses carry forward. On sale, claimed depreciation is recaptured at up to 25%, and gains may owe capital-gains tax (a 1031 exchange can defer both). Figures are a year-1 estimate at your 24.0% rate — not tax advice; consult a CPA.
Schools (NCES district)
- District
- Fort Osage R-I
- NCES district ID
- 2912290
- Math proficiency
- 28% ▼ -7.00%
- Reading proficiency
- 39% ▼ -5.00%
- Median HH income
- $57,441
- Composite
- 29.78/100
- National rank
- #6428
- State rank
- #213 of 324 in MO
Livability — Independence
- Score
- 82/100
- State rank
- #10
- US rank
- #1296
Category grades
Schools grade is shown separately in the Schools card above.
Census & demographics
- Census place
- Independence, MO
- County
- Jackson County · 687,798 people
- City population
- 117,675
- Metro
- Kansas City, MO-KS
- Population (ZIP)
- 17,395
- Household income
- $67,685
- Rent vs Own
- Severe rent burden
- 747.0
Population outlook (Jackson County) Hauer SSP2
- Today (2025)
- 719,589 people
- By 2030
- 731,456 · +1.6%
- By 2040
- 746,689 · +3.8%
- By 2050
- 749,289 · +4.1%
- By 2075
- 736,227 · +2.3%
- By 2100
- 668,210 · -7.1%
Race, ethnicity, and origin ACS 2023
- Neighborhood character
- Predominantly White (69%)
- Race & ethnicity
- White 69% Black 14% Hispanic / Latino 8% Two or more races 7% Pacific Islander 1%
- Hispanic origin (detail)
- Mexican 6%
- Common ancestry
- Italian 9% Lithuanian 2% Slovak 2%
- Foreign-born
- 3% · Canada
- Languages at home
- 96% English-only · Spanish 4%
Political lean MEDSL · Jackson
- 2024 margin
- D (+19.3) · D 58.9% · R 39.5% · Other 1.6%
- 2008→2024 swing
- -6.1pp toward R · 2008: 25.4pp · 2024: 19.3pp
- All cycles
- 2024: D+19.3 2020: D+22.0 2016: D+16.6 2012: D+19.0 2008: D+25.4
Not yet ingested
- Civics
- —
Market trends
- HPI YoY
- ▼ -163.60%
- Current HPI
- 286.349
- Rent YoY
- ▲ 3.76%
- Metro
- Kansas City, MO-KS
- State GDP YoY
- ▲ 1.84%
- F500 in state
- 20
Industry mix (Fortune 500 HQ in MO)
| Industry | F500 HQs | Revenue |
|---|---|---|
| Healthcare | 1 | $163B |
|
||
| Insurance | 1 | $21B |
|
||
| Industrial Technology | 1 | $17B |
|
||
| Retail | 1 | $16B |
|
||
| Industrial Distribution | 1 | $10B |
|
||
| Utilities | 1 | $9B |
|
||
Price history
-10.4% since first listed5 events — show timeline
- 2026-05-08 Price Changed $223,200 MARIS as Distributed by MLS Grid
- 2026-04-22 Price Changed $235,000 MARIS as Distributed by MLS Grid
- 2026-04-07 Listed $249,100 MARIS as Distributed by MLS Grid
- 2026-04-07 Coming Soon $249,100 MARIS as Distributed by MLS Grid
- 1990-04-16 Sold (Public Records) — Public Records
Property tax history
+9.3%/yrLatest (2025): $3,895 · -3.9% YoY. Source: county tax records.
Cash-flow waterfall
monthlySold comps — $/sqft
last 12 mo · ≤1 miLoading sold comps…