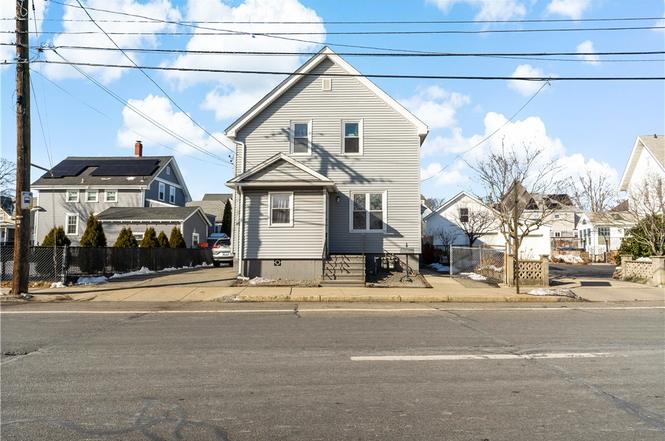
94 John St
East Providence, RI 02914
$449,000D
3 bd · 2.0 ba ·
1,512 sqft ·
Built 1920
· MultiFamily
· Pending
· 53 DOM
Cashflow @ list (25.0% down · 7.5%)
Estimated rent
$3,989/mo
Mortgage (P&I)
−$2,355
Tax + insurance
−$658
HOA
−$0
Vac / Maint / Mgmt
−$838
Net cashflow
$138/mo
Annual
$1,661/yr
Cap rate
6.66%
Cash-on-cash
1.32%
DSCR
1.06
1% rule
0.89%
Cash to close
$125,720
Investor read
- This is a 2 × 2-bed/1.0-bath units multifamily listed at $449k.
- At list price, monthly cash flow is $138 ($2k/yr) — positive. Per door: $69/mo.
- The deal already cash-flows at list — no discount required.
- To meet the 1% rule (rent ≥ 1% of price), the offer needs to be $399k (11.2% below list).
- It's been on market 53 days — a 3% lower offer ($436k) is reasonable based on typical stale-listing flexibility.
- Recommended offer: $399k (11.2% below list) — sets the bar for 1% rule.
- Local home prices are declining (-3.0%/yr); year-one equity from $3k of loan paydown is wiped out by about $13k of value loss. Plan a longer hold.
- Location reads 74/100 on livability (#12 in RI, #4,784 nationally) — a middle-class / working-renter tenant base. Strengths: crime A+, housing A+, health & safety A+; Watch: schools D-, amenities F, commute F.
- East Providence (suburban): math 18% / reading 31% proficiency, ranked #26 of 39 in RI (top 67%) — low school quality limits family demand, transient renter base, plan for 1-2y turnover.
- Watch-outs: built in 1920 — expect roof / HVAC / electrical / plumbing capex.
- Market conditions: 62 active listings in the ZIP; 12 comparable units currently listed for rent nearby; rentals at typical pace (median 17d on market — plan ~3-4 weeks tenant-placement turnaround); 776 units permitted in Providence County in 2024 (229 in 5+ unit buildings).
- Providence County population projected at +5% by 2050 — modest demand growth; plan on rents tracking national, not racing it.
- Climate carrying-cost: major wind risk, 74% chance of damaging wind over 30y; extreme-heat days projected 7→15/yr by 2055 (HVAC capex compounding) — expect insurance premiums to compound above CPI over the hold.
- Cap rate 6.7% vs local median 3.2% in East Providence — top-decile yield for the area; either an underpriced asset or a hidden risk that comps aren't pricing in. Stress-test before assuming the spread holds.
- At $3,989/mo this rent would consume 78% of the median local household income ($61k/yr) (locally 1134% of renters already pay >50% of income on rent) — very limited rent-growth headroom before tenants either downsize or default.
Questions for listing agent
- It's been on market 53 days. Have you received any prior offers? Is the seller open to a 11% concession, seller financing, or rate buy-down credit?
- Can we see the unit-by-unit rent roll, current vacancy, and any below-market leases? What's the average tenancy length?
- What capital expenditures (roof, boiler, parking lot, exteriors) have been made in the last 5 years, and what's planned in the next 2?
- Built in 1920 — when were the roof, HVAC, electrical panel, plumbing, and water heater last replaced?
- Is there a deadline driving the sale (1031 exchange, divorce, estate, relocation)? That informs how much negotiation room exists.
- Schools are D-rated, which usually means shorter tenancies and higher turnover. Who's the typical renter profile here, and what's been the actual vacancy rate?
- The area grade is low — what's the realistic commute time and amenity access for the typical tenant pool here? Any planned neighborhood developments (good or bad) we should know about?
- What's the average days-on-market for RENTAL listings here right now (not sales)? A rising rental-DOM trend means longer vacancies and softer asking-rent achievability than the comps imply.
CashFlowRE · CFR-5W6SVEEFT2WGS6
· Data 3 weeks ago
cashflowre.app · 2026-05-29