 Duplex
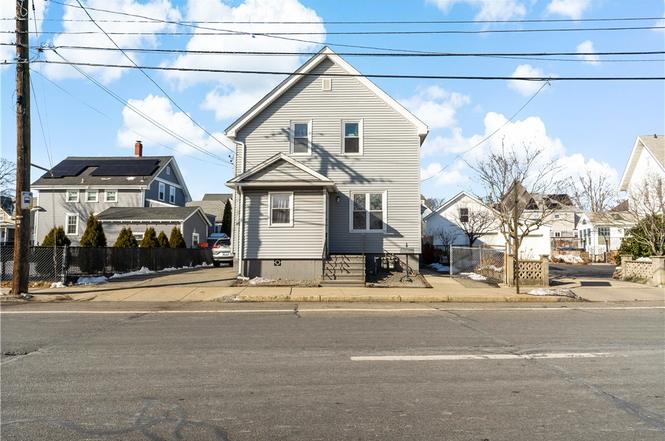
94 John St · East Providence, RI
Flood risk 1/10 · Minimal
- FEMA flood zone
- X (unshaded)
- Chance of flooding over 30 yrs
- 0.0%
- Est. flood insurance / yr
- $473 – $860
Fire risk 1/10 · Minimal
- Est. fire insurance / yr
- $835 – $1,551
Heat risk 5/10 · Moderate
- Hot days now (above 98°F)
- 7 days/yr
- Hot days in 30 yrs
- 15 days/yr
Wind risk 6/10 · Moderate
- Chance of severe wind over 30 yrs
- 74.0%
Air-quality risk 2/10 · Minimal
- Unhealthy air days now
- 1 days/yr
- Unhealthy air days in 30 yrs
- 2 days/yr
Risk factors via First Street. Map © Google.
Why this score? — see what drove the D grade
The composite is a weighted blend of 9 inputs, each scored 0–100. Each bar is that input's sub-score; the figure is the points it added to the 100-point composite (weight × sub-score).
- Cash flow +15.0/30.0
- ARV discount +7.7/15.0
- DSCR +4.6/10.0
- 1% rule +3.9/10.0
- Livability +3.7/5.0
- Rent growth +2.5/5.0
- Condition / age +2.5/5.0
- Schools +2.2/10.0
- Appreciation +0.0/10.0
$449,000
🖨 Deal sheet 📄 Offer letter ✓ Due diligence
Multi-family units
County records classify this as Multi-Family (2-4 Unit). Listing-text estimate: 2 units. confirmed
Listing remarks
Do not miss this well-maintained two-family home offering flexibility, comfort, and convenience. This property features two clean and spacious apartments, each with a desirable 2-bedroom, 1-bath layout and its own private entrance. The units offer generous room sizes, hardwood floors throughout the living areas, and tile flooring in the bathrooms, creating a clean, durable, and classic feel. Both apartments are move-in ready and thoughtfully laid out for comfortable everyday living. The exterior is finished with low-maintenance vinyl siding. The home includes two off-street parking spaces. A fully fenced backyard provides a great outdoor space, complete with a shed for additional storage. E
Key facts
- Off street parking
- Private entrance
- Two family home
Tags
Neighborhood map
What this means for you Summary
Snapshot
- This is a 2 × 2-bed/1.0-bath units multifamily listed at $449k.
Deal economics
- At list price, monthly cash flow is $138 ($2k/yr) — positive. Per door: $69/mo.
- The deal already cash-flows at list — no discount required.
- To meet the 1% rule (rent ≥ 1% of price), the offer needs to be $399k (11.2% below list).
- Recommended offer: $399k (11.2% below list) — sets the bar for 1% rule.
- Cap rate 6.7% vs local median 3.2% in East Providence — top-decile yield for the area; either an underpriced asset or a hidden risk that comps aren't pricing in. Stress-test before assuming the spread holds.
Location & tenants
- Location reads 74/100 on livability (#12 in RI, #4,784 nationally) — a middle-class / working-renter tenant base. Strengths: crime A+, housing A+, health & safety A+; Watch: schools D-, amenities F, commute F.
- East Providence (suburban): math 18% / reading 31% proficiency, ranked #26 of 39 in RI (top 67%) — low school quality limits family demand, transient renter base, plan for 1-2y turnover.
- Market conditions: 62 active listings in the ZIP; 12 comparable units currently listed for rent nearby; rentals at typical pace (median 17d on market — plan ~3-4 weeks tenant-placement turnaround); 776 units permitted in Providence County in 2024 (229 in 5+ unit buildings).
- At $3,989/mo this rent would consume 78% of the median local household income ($61k/yr) (locally 1134% of renters already pay >50% of income on rent) — very limited rent-growth headroom before tenants either downsize or default.
Forward outlook
- Local home prices are declining (-3.0%/yr); year-one equity from $3k of loan paydown is wiped out by about $13k of value loss. Plan a longer hold.
- Providence County population projected at +5% by 2050 — modest demand growth; plan on rents tracking national, not racing it.
Negotiation context
- It's been on market 53 days — a 3% lower offer ($436k) is reasonable based on typical stale-listing flexibility.
Risks & watch-outs
- Watch-outs: built in 1920 — expect roof / HVAC / electrical / plumbing capex.
- Climate carrying-cost: major wind risk, 74% chance of damaging wind over 30y; extreme-heat days projected 7→15/yr by 2055 (HVAC capex compounding) — expect insurance premiums to compound above CPI over the hold.
Questions for the listing agent
- It's been on market 53 days. Have you received any prior offers? Is the seller open to a 11% concession, seller financing, or rate buy-down credit?
- Can we see the unit-by-unit rent roll, current vacancy, and any below-market leases? What's the average tenancy length?
- What capital expenditures (roof, boiler, parking lot, exteriors) have been made in the last 5 years, and what's planned in the next 2?
- Built in 1920 — when were the roof, HVAC, electrical panel, plumbing, and water heater last replaced?
- Is there a deadline driving the sale (1031 exchange, divorce, estate, relocation)? That informs how much negotiation room exists.
- Schools are D-rated, which usually means shorter tenancies and higher turnover. Who's the typical renter profile here, and what's been the actual vacancy rate?
- The area grade is low — what's the realistic commute time and amenity access for the typical tenant pool here? Any planned neighborhood developments (good or bad) we should know about?
- What's the average days-on-market for RENTAL listings here right now (not sales)? A rising rental-DOM trend means longer vacancies and softer asking-rent achievability than the comps imply.
- What's the recent tenant-quality profile in this submarket — average credit score on applications, eviction rate, late-payment / NSF rate, and stable-employment percentage? A property-management company in the area should have these aggregated.
- How much new apartment / multifamily construction is in the pipeline within 1–3 miles? Heavy new supply (>2% of stock underway) typically softens rents 12–24 months out; light construction supports rent growth.
Investment metrics
- 1% rule
- 0.89% ✗
- Cap rate
- 6.66%
- Cash-on-cash
- 1.32%
- DSCR
- 1.06
- GRM
- 9.4
CMA / ARV
- ARV (on-the-fly)
- $450,576
- Comps found
- 12
Show comp detail 12 sales within ~0.75 mi
| Address | Dist | Beds/Ba | Sqft | Sold | Price | $/sf | Match |
|---|---|---|---|---|---|---|---|
| 94 John St | 0.00mi | 4/2.0 (+1) | 1,512 (0%) | 1mo | $450,000 | $298 | 94 |
| 100 Sutton Ave | 0.34mi | 3/2.0 | 1,480 (-2%) | 12mo | $485,000 | $328 | 70 |
| 21 Donnelly St | 0.62mi | 3/3.0 | 1,496 (-1%) | 3mo | $465,000 | $311 | 63 |
| 7 Oakley St | 0.43mi | 3/2.0 | 1,582 (+5%) | 11mo | $381,000 | $241 | 63 |
| 136 Grove Ave | 0.25mi | 3/2.0 | 1,386 (-8%) | 18mo | $440,000 | $317 | 60 |
| 13 Orchard St | 0.45mi | 4/2.0 (+1) | 1,466 (-3%) | 14mo | $459,000 | $313 | 57 |
| 100 Hicks St | 0.43mi | 4/3.0 (+1) | 1,588 (+5%) | 12mo | $416,501 | $262 | 53 |
| 401 Waterman Ave | 0.42mi | 2/2.0 (-1) | 1,444 (-4%) | 23mo | $400,000 | $277 | 49 |
| 84 Miles Ave | 0.72mi | 2/2.0 (-1) | 1,532 (+1%) | 20mo | $440,000 | $287 | 43 |
| 95 Dewey Ave | 0.60mi | 4/2.0 (+1) | 1,408 (-7%) | 18mo | $400,000 | $284 | 41 |
| 34 Roma St | 0.63mi | 4/2.0 (+1) | 1,588 (+5%) | 23mo | $505,000 | $318 | 38 |
| 35 Winsor St | 0.58mi | 4/2.0 (+1) | 1,718 (+14%) | 13mo | $474,900 | $276 | 35 |
Match score weights: distance 35% · size 25% · config 20% · recency 20%. Top-matched comps best support the ARV.
Projected returns pro-forma
-3.0% appreciation · 3.0% rent growth · sell at horizon
- IRR
- -14.2%
- Equity multiple
- 0.49×
- Total profit
- $-63,934
- Equity at exit
- $66,947
- IRR
- -5.4%
- Equity multiple
- 0.65×
- Total profit
- $-44,298
- Equity at exit
- $38,821
Cash invested: $125,720 (down + closing). Projections, not guarantees.
Landlord ↔ Tenant lean methodology
- Overall (STATE)
- 31 Tenant-Leaning
- State Rhode Island
- 31 Tenant-Leaning · D+8
- County
- — inherits STATE
- City
- — inherits STATE
ZIP-level market 02914
- Active inventory
- 62
- Price-to-rent
- 18.8×
Monthly cashflow live
- Estimated rent
- $3,989 high interval (Pro) →
- Mortgage (P&I)
- −$2,355
- Tax from tax record
- −$471 /mo · $5,654/yr
- Insurance
- −$187
- HOA
- −$0
- Vacancy / Maint / Mgmt
- −$838
- Net cashflow
- $138
Break-even live
2-unit breakdown (identical units grouped — click to expand)
| Units | Beds | Baths | Est. rent |
|---|---|---|---|
| 2× units | 2 | 1 | $3,990 |
| #1 | 2 | 1 | $1,995 |
| #2 | 2 | 1 | $1,995 |
| Total (2 units) | $3,989 | ||
UW: 25.0% down · 7.5% · 30yr · 1.5% tax · 5.0% vac · 8.0% maint · 8.0% mgmt
Financing live
Cash to close
- Down payment
- $112,250
- Closing costs
- $13,470
- Reserves months
- —
- Total cash needed
- —
Loan-product check · same deal, 3 products live
Conventional
25% down · 7.5% · 30yr
- Down + closing
- —
- Monthly P&I
- —
- Monthly cashflow
- —
- DSCR
- —
- Eligible?
- —
Personal DTI + credit; lowest rate.
DSCR
20% down · 8.5% · 30yr
- Down + closing
- —
- Monthly P&I
- —
- Monthly cashflow
- —
- DSCR
- —
- Eligible?
- —
No personal income docs; deal must DSCR.
Hard money
10% down · 12.0% · 12mo
- Down + closing
- —
- Monthly P&I
- —
- Monthly cashflow
- —
- DSCR
- —
- Eligible?
- —
Short-term bridge; refi at stabilization.
Rent comps 12 comps
| Address | Beds | Baths | Sqft | Rent | $/sqft | DOM | Units | Dist |
|---|---|---|---|---|---|---|---|---|
| 168 Waterman Ave East Providence, RI | 3.0 | 1.0 | 1200 | $2,500 | $2.08 | 4d | 1 | 0.15mi |
| 49 Ivy St Unit 2 East Providence, RI | 2.0 | 1.0 | 1080 | $1,750 | $1.62 | 23d | 1 | 0.22mi |
| 50 Reynolds St Unit 2 East Providence, RI | 3.0 | 1.0 | 1261 | $2,000 | $1.59 | 17d | 1 | 0.39mi |
| 114 Warren Ave East Providence, RI | 3.0 | 1.0 | 1200 | $2,100 | $1.75 | 2d | 1 | 0.52mi |
| 55 Second St East Providence, RI | 3.0 | 1.0 | 1100 | $2,150 | $1.95 | 23d | 1 | 0.77mi |
| 98 Butler Ave Providence, RI | 4.0 | 2.0 | 1890 | $5,000 | $2.65 | 2d | 1 | 0.88mi |
| 159 Tangent St Unit 2 East Providence, RI | 3.0 | 1.0 | 1100 | $2,000 | $1.82 | 11d | 1 | 0.94mi |
| 77 Pitman St Providence, RI | 2.0–3.0 | 1.0–2.0 | 950 | $2,750 | $2.89 | 1d | 1 | 1.02mi |
| 54 Furnace St Unit 1 Providence, RI | 2.0 | 1.0 | 1184 | $2,350 | $1.98 | 17d | 1 | 1.02mi |
| 16 Trenton St Providence, RI | 1.0–4.0 | 1.0–3.0 | 800 | $3,217 | $4.02 | 17d | 14 | 1.13mi |
| 180 George M Cohan Blvd Providence, RI | 2.0 | 1.0–2.0 | 922 | $4,150 | $4.50 | 3d | 17 | 1.23mi |
| 138 Martin St East Providence, RI | 3.0 | 2.0 | 2009 | $2,800 | $1.39 | 43d | 1 | 1.36mi |
Listing history 2 events
-
2026-03-27status Pending
-
2026-02-02$449,000 Active
ⓘ Source: listings_history table (triggers on properties + properties_extension) + one-shot
backfill from property_details.listing_events for pre-trigger history.
Tax reassessment forecast RI · Partial reset (capped growth)
- Current annual tax
- $5,654 · $471/mo
- Projected year-2 tax
- $6,486 · $541/mo
- Expected delta
- +$832/yr (+$69/mo · 14.7%)
ⓘ Screening estimate from a state-policy table — verify with the county assessor before closing.
Climate risk First Street
- Flood 1/10 Low FEMA zone X (unshaded) · 0% chance over 30 yrs
- Wildfire 1/10 Low
- Heat 5/10 Major 7 d/yr ≥98°F today · 15 d/yr by 30 yrs out
- Wind 6/10 Major 74% chance of damaging wind over 30 yrs
- Air quality 2/10 Low 1 unhealthy d/yr today · 2 by 30 yrs out
Nearby sold comps map
Loading sold comps map…
Walkable amenities ~0.75 mi
Loading nearby amenities…
Taxation est. · year 1
- Rental income
- $47,868
- − Mortgage interest
- −$25,151
- − Property taxes
- −$5,654
- − Insurance
- −$2,245
- − Repairs & maintenance
- −$3,829
- − Management
- −$3,829
- − Depreciation
- −$13,062
- Taxable loss
- −$5,903
- Est. tax savings @ 24.0%
- +$1,417
- After-tax cash flow
- $3,078/yr
For passive investors: Depreciation is non-cash, so a rental often shows a tax loss while cash-flowing — sheltering income. Rental losses are passive: they offset passive income freely, and up to $25,000/yr can offset ordinary (W-2) income if you actively participate and your MAGI is under $100k (phasing out to $0 by $150k); unused losses carry forward. On sale, claimed depreciation is recaptured at up to 25%, and gains may owe capital-gains tax (a 1031 exchange can defer both). Figures are a year-1 estimate at your 24.0% rate — not tax advice; consult a CPA.
Schools (NCES district)
- District
- East Providence
- NCES district ID
- 4400330
- Math proficiency
- 18% ▼ -8.00%
- Reading proficiency
- 31% ▼ -5.00%
- Median HH income
- $51,011
- Composite
- 21.69/100
- National rank
- #8274
- State rank
- #26 of 39 in RI
Livability — East Providence
- Score
- 74/100
- State rank
- #12
- US rank
- #4784
Category grades
Schools grade is shown separately in the Schools card above.
Census & demographics
- Census place
- East Providence, RI
- County
- Providence County · 548,917 people
- City population
- 38,586
- Metro
- Providence-Warwick, RI-MA
- Population (ZIP)
- 21,834
- Household income
- $61,191
- Rent vs Own
- Severe rent burden
- 1134.0
Population outlook (Providence County) Hauer SSP2
- Today (2025)
- 653,469 people
- By 2030
- 660,819 · +1.1%
- By 2040
- 672,747 · +3.0%
- By 2050
- 683,741 · +4.6%
- By 2075
- 720,435 · +10.2%
- By 2100
- 741,582 · +13.5%
Race, ethnicity, and origin ACS 2023
- Neighborhood character
- Predominantly White (67%)
- Race & ethnicity
- White 67% Two or more races 12% Hispanic / Latino 12% Black 8% Asian 4% Native American 1%
- Hispanic origin (detail)
- Puerto Rican 4% Dominican 3%
- Common ancestry
- Russian 29% Lithuanian 4% Romanian 3%
- Foreign-born
- 24% · Canada, China
- Languages at home
- 67% English-only · Other Indo-European 20% Spanish 7% French/Haitian/Cajun 2%
Political lean MEDSL · Providence
- 2024 margin
- D (+14.4) · D 56.1% · R 41.7% · Other 2.2%
- 2008→2024 swing
- -20.0pp toward R · 2008: 34.4pp · 2024: 14.4pp
- All cycles
- 2024: D+14.4 2020: D+22.9 2016: D+21.2 2012: D+34.9 2008: D+34.4
Not yet ingested
- Civics
- —
Market trends
- HPI YoY
- ▼ -461.46%
- Current HPI
- 323.298
- Rent YoY
- —
- Metro
- Providence-Warwick, RI-MA
- State GDP YoY
- ▲ 2.25%
- F500 in state
- 10
Industry mix (Fortune 500 HQ in RI)
| Industry | F500 HQs | Revenue |
|---|---|---|
| Healthcare | 1 | $373B |
|
||
| Food Distribution | 1 | $31B |
|
||
| Aerospace / Defense | 1 | $14B |
|
||
| Financial Services | 1 | $8B |
|
||
| Consumer Goods | 1 | $4B |
|
||
Price history
2 events — show timeline
- 2026-03-27 Pending — RIS
- 2026-02-02 Listed $449,000 RIS
Property tax history
+3.4%/yrLatest (2025): $5,654 · +21.6% YoY. Source: county tax records.
Cash-flow waterfall
monthlySold comps — $/sqft
last 12 mo · ≤1 miLoading sold comps…