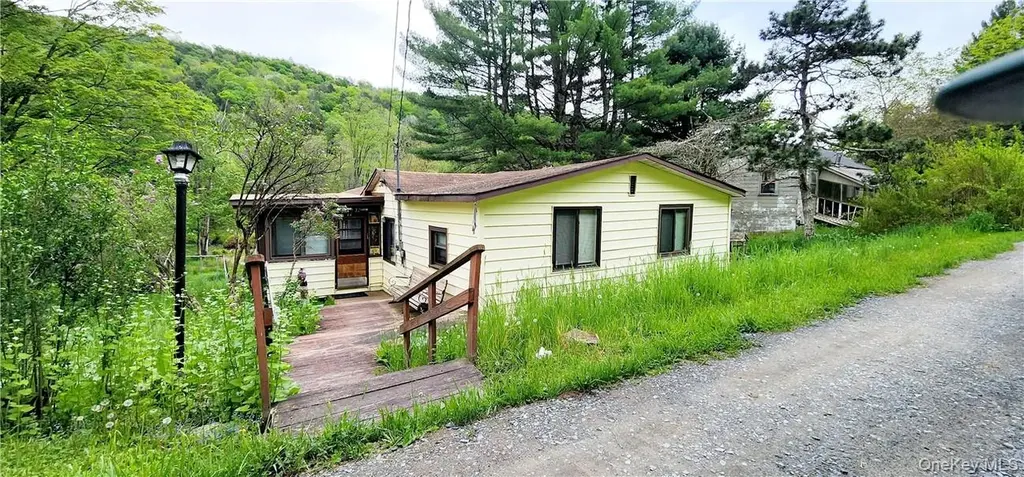
32 Brookside Dr
Grahamsville, NY 12788
$145,000B+
4 bd · 1.0 ba ·
832 sqft ·
Built 1949
· SingleFamily
· Active
· 20 DOM
Cashflow @ list (25.0% down · 7.5%)
Estimated rent
$1,650/mo
Mortgage (P&I)
−$760
Tax + insurance
−$172
HOA
−$0
Vac / Maint / Mgmt
−$346
Net cashflow
$371/mo
Annual
$4,453/yr
Cap rate
9.36%
Cash-on-cash
10.97%
DSCR
1.49
1% rule
1.14%
Cash to close
$40,600
Investor read
- This is a 4-bed/1.0-bath single-family listed at $145k.
- At list price, monthly cash flow is $371 ($4k/yr) — positive.
- The deal already cash-flows at list — no discount required.
- Meets the 1% rule at list price ($2k rent vs $145k).
- It's been on market 20 days — a 2% lower offer ($143k) is reasonable based on typical stale-listing flexibility.
- Recommended offer: $143k (1.5% below list) — sets the bar for market timing.
- In year one you build about $16k of equity ($1k loan paydown + $14k appreciation (10.0% local appreciation)).
- Location reads: area grade B — affects rentability + tenant quality, not the cash-flow math above.
- Tri-Valley Central School District (rural): math 38% / reading 46% proficiency, ranked #488 of 590 in NY (top 83%) — families likely to look elsewhere, expect single-tenant / working-renter base with shorter leases.
- Zoned schools: Tri-Valley Elementary School (math 27% / reading 47%, grade F, #1,519 of 2,108 statewide, top 74%, 462 students, 50% FRL); Tri-Valley Secondary School (math 52% / reading 47%, grade D, #974 of 1,100 statewide, top 91%, 435 students, 49% FRL) — zoned schools average 50% FRL vs 28% district-wide (21 pts higher); higher-poverty schools than district average — tighter screening recommended.
- Watch-outs: built in 1949 — expect roof / HVAC / electrical / plumbing capex.
- Market conditions: 28 active listings in the ZIP; 739 units permitted in Sullivan County in 2024 (5 in 5+ unit buildings).
- Sullivan County population projected at -24% by 2050 — secular population decline; favor cash flow + early exit over multi-decade hold.
- 4 sale attempts since 3y ago with the ask held roughly flat each time — persistent listings suggest the price (not the market) is what's stuck; bring a comps-based counter.
- At projected returns (10.0% appreciation + 3.0% rent growth), your $41k cash investment doubles in ~2 years — after that, you're playing with house money.
- By year 3, paydown + projected appreciation supports a ~$39k cash-out refi (75% LTV) — recoverable capital for the next deal without selling this one.
- Climate carrying-cost: major flood risk — expect insurance premiums to compound above CPI over the hold.
- Cap rate 9.4% vs local median 1.7% in Grahamsville — top-decile yield for the area; either an underpriced asset or a hidden risk that comps aren't pricing in. Stress-test before assuming the spread holds.
Questions for listing agent
- Built in 1949 — when were the roof, HVAC, electrical panel, plumbing, and water heater last replaced?
- Is there a deadline driving the sale (1031 exchange, divorce, estate, relocation)? That informs how much negotiation room exists.
- What's the average days-on-market for RENTAL listings here right now (not sales)? A rising rental-DOM trend means longer vacancies and softer asking-rent achievability than the comps imply.
- What's the recent tenant-quality profile in this submarket — average credit score on applications, eviction rate, late-payment / NSF rate, and stable-employment percentage? A property-management company in the area should have these aggregated.
- How much new for-sale + rental construction is in the pipeline within 1–3 miles? Heavy new supply typically softens prices + rents 12–24 months out; constrained supply supports both.
CashFlowRE · CFR-5WYTGX19FACX2S
· Data 5 h ago
cashflowre.app · 2026-05-29