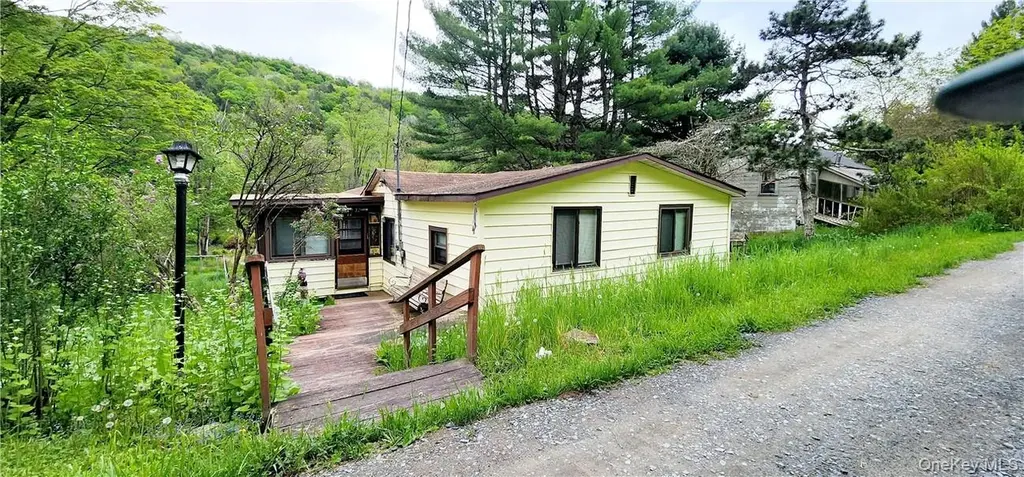
32 Brookside Dr · Grahamsville, NY
Flood risk 6/10 · Moderate
- FEMA flood zone
- X (unshaded)
- Chance of flooding over 30 yrs
- 0.71%
- Est. flood insurance / yr
- $507 – $1,088
Fire risk 3/10 · Minor
- Est. fire insurance / yr
- $691 – $1,283
Heat risk 2/10 · Minimal
- Hot days now (above 91°F)
- 7 days/yr
- Hot days in 30 yrs
- 16 days/yr
Wind risk 2/10 · Minimal
- Chance of severe wind over 30 yrs
- 4.0%
Air-quality risk 2/10 · Minimal
- Unhealthy air days now
- 0 days/yr
- Unhealthy air days in 30 yrs
- 1 days/yr
Risk factors via First Street. Map © Google.
Why this score? — see what drove the B+ grade
The composite is a weighted blend of 9 inputs, each scored 0–100. Each bar is that input's sub-score; the figure is the points it added to the 100-point composite (weight × sub-score).
- Cash flow +26.2/30.0
- ARV discount +15.0/15.0
- Appreciation +10.0/10.0
- DSCR +8.9/10.0
- 1% rule +6.4/10.0
- Schools +3.6/10.0
- Rent growth +2.5/5.0
- Livability +2.5/5.0
- Condition / age +2.5/5.0
$145,000
🖨 Deal sheet 📄 Offer letter ✓ Due diligence
Listing remarks
What a treat! Perfect vacation in the Catskills. This 3 season home with 4 bedroom, 2 baths , country kitchen with the island, living room and den with build shelves, cozy sunroom to relax and the best feature of the house is a huge deck overlooking scenic property with the Wynkoop brook in the back. Out side shower and storage, playground's and the shed for your tools. Located on the private road in the town of Neversink in the lake paradise subdivision close to 2 towns Neversink with the fabulous Neversink Market and Grahamsville the home of the Little Wold Grahamsville Fair, Daniel Pierce Library and the the Valley Museum Additional Information: Amenities:Storage,
Key facts
- Country kitchen
- Private road
- Storage
Tags
Property features AI
Finance
- HOA & community: Community park; Community pool; Community tennis courts
Exterior
- Parking: On-street parking
- Utilities: Electric service by Central Hudson; Septic tank; Private trash collection
- Home design: Single-family residence; Actual property condition
- Construction: Frame construction; Vinyl siding
- Exterior features: Shed(s); Located on a cul-de-sac; Near school; Sloped lot; Views; Waterfront
Interior
- Kitchen: Dishwasher; Refrigerator
- Bedrooms: Total rooms: 7
- Bathrooms: 2 full bathrooms
- Heating & cooling: Baseboard heating; Electric heating; No central cooling
- Interior features: Built-in features; Eat-in kitchen; Master bedroom on main floor; Porch
- Laundry & utility: Electric water heater
Neighborhood map
What this means for you Summary
Snapshot
- This is a 4-bed/1.0-bath single-family listed at $145k.
Deal economics
- At list price, monthly cash flow is $371 ($4k/yr) — positive.
- The deal already cash-flows at list — no discount required.
- Meets the 1% rule at list price ($2k rent vs $145k).
- Recommended offer: $143k (1.5% below list) — sets the bar for market timing.
- Cap rate 9.4% vs local median 1.7% in Grahamsville — top-decile yield for the area; either an underpriced asset or a hidden risk that comps aren't pricing in. Stress-test before assuming the spread holds.
Location & tenants
- Location reads: area grade B — affects rentability + tenant quality, not the cash-flow math above.
- Tri-Valley Central School District (rural): math 38% / reading 46% proficiency, ranked #488 of 590 in NY (top 83%) — families likely to look elsewhere, expect single-tenant / working-renter base with shorter leases.
- Zoned schools: Tri-Valley Elementary School (math 27% / reading 47%, grade F, #1,519 of 2,108 statewide, top 74%, 462 students, 50% FRL); Tri-Valley Secondary School (math 52% / reading 47%, grade D, #974 of 1,100 statewide, top 91%, 435 students, 49% FRL) — zoned schools average 50% FRL vs 28% district-wide (21 pts higher); higher-poverty schools than district average — tighter screening recommended.
- Market conditions: 28 active listings in the ZIP; 739 units permitted in Sullivan County in 2024 (5 in 5+ unit buildings).
Forward outlook
- In year one you build about $16k of equity ($1k loan paydown + $14k appreciation (10.0% local appreciation)).
- Sullivan County population projected at -24% by 2050 — secular population decline; favor cash flow + early exit over multi-decade hold.
- At projected returns (10.0% appreciation + 3.0% rent growth), your $41k cash investment doubles in ~2 years — after that, you're playing with house money.
- By year 3, paydown + projected appreciation supports a ~$39k cash-out refi (75% LTV) — recoverable capital for the next deal without selling this one.
Negotiation context
- It's been on market 18 days — a 2% lower offer ($143k) is reasonable based on typical stale-listing flexibility.
- 4 sale attempts since 3y ago with the ask held roughly flat each time — persistent listings suggest the price (not the market) is what's stuck; bring a comps-based counter.
Risks & watch-outs
- Watch-outs: built in 1949 — expect roof / HVAC / electrical / plumbing capex.
- Climate carrying-cost: major flood risk — expect insurance premiums to compound above CPI over the hold.
Questions for the listing agent
- Built in 1949 — when were the roof, HVAC, electrical panel, plumbing, and water heater last replaced?
- Is there a deadline driving the sale (1031 exchange, divorce, estate, relocation)? That informs how much negotiation room exists.
- What's the average days-on-market for RENTAL listings here right now (not sales)? A rising rental-DOM trend means longer vacancies and softer asking-rent achievability than the comps imply.
- What's the recent tenant-quality profile in this submarket — average credit score on applications, eviction rate, late-payment / NSF rate, and stable-employment percentage? A property-management company in the area should have these aggregated.
- How much new for-sale + rental construction is in the pipeline within 1–3 miles? Heavy new supply typically softens prices + rents 12–24 months out; constrained supply supports both.
Investment metrics
- 1% rule
- 1.14% ✓
- Cap rate
- 9.36%
- Cash-on-cash
- 10.97%
- DSCR
- 1.49
- GRM
- 7.3
CMA / ARV
- ARV (on-the-fly)
- $262,912
- Comps found
- 1
Show comp detail 1 sale within ~0.75 mi
| Address | Dist | Beds/Ba | Sqft | Sold | Price | $/sf | Match |
|---|---|---|---|---|---|---|---|
| 107 Overlook Rd | 0.22mi | 3/1.0 (-1) | 904 (+9%) | 7mo | $286,000 | $316 | 64 |
Match score weights: distance 35% · size 25% · config 20% · recency 20%. Top-matched comps best support the ARV.
Projected returns pro-forma
10.0% appreciation · 3.0% rent growth · sell at horizon
- IRR
- 32.3%
- Equity multiple
- 3.53×
- Total profit
- $102,587
- Equity at exit
- $130,627
- IRR
- 27.9%
- Equity multiple
- 7.98×
- Total profit
- $283,480
- Equity at exit
- $281,703
Cash invested: $40,600 (down + closing). Projections, not guarantees.
Landlord ↔ Tenant lean methodology
- Overall (STATE)
- 15 Strongly Tenant-Friendly
- State New York
- 15 Strongly Tenant-Friendly · D+10
- County
- — inherits STATE
- City
- — inherits STATE
ZIP-level market 12788
- Home prices YoY
- 2.4%
- Active inventory
- 28
- Price-to-rent
- 7.3×
Monthly cashflow live
- Estimated rent
- $1,650 medium interval (Pro) →
- Mortgage (P&I)
- −$760
- Tax from tax record
- −$112 /mo · $1,339/yr
- Insurance
- −$60
- HOA
- −$0
- Vacancy / Maint / Mgmt
- −$346
- Net cashflow
- $371
Break-even live
UW: 25.0% down · 7.5% · 30yr · 1.5% tax · 5.0% vac · 8.0% maint · 8.0% mgmt
Financing live
Cash to close
- Down payment
- $36,250
- Closing costs
- $4,350
- Reserves months
- —
- Total cash needed
- —
Loan-product check · same deal, 3 products live
Conventional
25% down · 7.5% · 30yr
- Down + closing
- —
- Monthly P&I
- —
- Monthly cashflow
- —
- DSCR
- —
- Eligible?
- —
Personal DTI + credit; lowest rate.
DSCR
20% down · 8.5% · 30yr
- Down + closing
- —
- Monthly P&I
- —
- Monthly cashflow
- —
- DSCR
- —
- Eligible?
- —
No personal income docs; deal must DSCR.
Hard money
10% down · 12.0% · 12mo
- Down + closing
- —
- Monthly P&I
- —
- Monthly cashflow
- —
- DSCR
- —
- Eligible?
- —
Short-term bridge; refi at stabilization.
Listing history 14 events
-
2026-06-18days on market $145,000 Active 18 DOM
-
2026-06-17days on market $145,000 Active 17 DOM
-
2026-06-16days on market $145,000 Active 16 DOM
-
2026-06-15days on market $145,000 Active 15 DOM
-
2026-06-13days on market $145,000 Active 13 DOM
-
2026-06-12days on market $145,000 Active 12 DOM
-
2026-06-09days on market $145,000 Active 9 DOM
-
2026-06-08days on market $145,000 Active 8 DOM
-
2026-06-07days on market $145,000 Active 7 DOM
-
2026-06-07days on market $145,000 Active 6 DOM
-
2026-06-04days on market $145,000 Active 3 DOM
-
2026-06-02days on market $145,000 Active 2 DOM
-
2026-05-31remarks 677-char remark
-
2026-05-31$145,000 Active 1 DOM
ⓘ Source: listings_history table (triggers on properties + properties_extension) + one-shot
backfill from property_details.listing_events for pre-trigger history.
Tax reassessment forecast NY · Partial reset (capped growth)
- Current annual tax
- $1,339 · $112/mo
- Projected year-2 tax
- $1,895 · $158/mo
- Expected delta
- +$556/yr (+$46/mo · 41.5%)
ⓘ Screening estimate from a state-policy table — verify with the county assessor before closing.
Climate risk First Street
- Flood 6/10 Major FEMA zone X (unshaded) · 71% chance over 30 yrs
- Wildfire 3/10 Moderate
- Heat 2/10 Low 7 d/yr ≥91°F today · 16 d/yr by 30 yrs out
- Wind 2/10 Low 4% chance of damaging wind over 30 yrs
- Air quality 2/10 Low 0 unhealthy d/yr today · 1 by 30 yrs out
Nearby sold comps map
Loading sold comps map…
Walkable amenities ~0.75 mi
Loading nearby amenities…
Taxation est. · year 1
- Rental income
- $19,800
- − Mortgage interest
- −$8,122
- − Property taxes
- −$1,339
- − Insurance
- −$725
- − Repairs & maintenance
- −$1,584
- − Management
- −$1,584
- − Depreciation
- −$4,218
- Taxable income
- $2,227
- Est. tax owed @ 24.0%
- −$535
- After-tax cash flow
- $3,918/yr
For passive investors: Depreciation is non-cash, so a rental often shows a tax loss while cash-flowing — sheltering income. Rental losses are passive: they offset passive income freely, and up to $25,000/yr can offset ordinary (W-2) income if you actively participate and your MAGI is under $100k (phasing out to $0 by $150k); unused losses carry forward. On sale, claimed depreciation is recaptured at up to 25%, and gains may owe capital-gains tax (a 1031 exchange can defer both). Figures are a year-1 estimate at your 24.0% rate — not tax advice; consult a CPA.
Schools (NCES district)
- District
- Tri-Valley Central School District
- NCES district ID
- 3628890
- Math proficiency
- 38% ▼ -10.00%
- Reading proficiency
- 46% ▲ 2.00%
- Median HH income
- $53,543
- Composite
- 36.47/100
- National rank
- #4662
- State rank
- #488 of 590 in NY
Livability — Grahamsville
No livability data for this city. (Only ~50 U.S. cities are tracked.)
Census & demographics
- Population (ZIP)
- 3,122
Population outlook (Sullivan County) Hauer SSP2
- Today (2025)
- 68,974 people
- By 2030
- 65,609 · -4.9%
- By 2040
- 58,878 · -14.6%
- By 2050
- 52,500 · -23.9%
- By 2075
- 39,941 · -42.1%
- By 2100
- 28,880 · -58.1%
Race, ethnicity, and origin ACS 2023
- Neighborhood character
- Diverse neighborhood (Simpson 0.60)
- Race & ethnicity
- White 57% Hispanic / Latino 22% Black 16% Two or more races 12%
- Hispanic origin (detail)
- Mexican 6% Puerto Rican 5% Dominican 5%
- Common ancestry
- Romanian 5% Scotch-Irish 4% Iranian 4%
- Foreign-born
- 12% · Canada, Jamaica
- Languages at home
- 89% English-only · Spanish 9% Russian/Polish/Slavic 1% Other Indo-European 1%
Political lean MEDSL · Sullivan
- 2024 margin
- R (+16.7) · D 41.6% · R 58.4%
- 2008→2024 swing
- -26.2pp toward R · 2008: 9.5pp · 2024: -16.7pp
- All cycles
- 2024: R+16.7 2020: R+9.2 2016: R+13.7 2012: D+10.4 2008: D+9.5
Not yet ingested
- Civics
- —
Market trends
- HPI YoY
- ▲ 10.93%
- Current HPI
- 472.8635
- Rent YoY
- —
- Metro
- —
- State GDP YoY
- ▲ 2.60%
- F500 in state
- 92
Industry mix (Fortune 500 HQ in NY)
| Industry | F500 HQs | Revenue |
|---|---|---|
| Financial Services | 10 | $950B |
|
||
| Consumer Goods | 9 | $162B |
|
||
| Insurance | 4 | $225B |
|
||
| Telecommunications | 2 | $144B |
|
||
| Pharmaceuticals | 2 | $112B |
|
||
| Media / Entertainment | 2 | $69B |
|
||
Price history
-27.5% since first listed8 events — show timeline
- 2026-05-31 Listed $145,000 OneKey® MLS as Distributed by MLS Grid
- 2025-12-01 Listing Removed — OneKey® MLS as Distributed by MLS Grid
- 2025-08-10 Listed $150,000 OneKey® MLS as Distributed by MLS Grid
- 2024-12-17 Listing Removed — OneKey® MLS as Distributed by MLS Grid
- 2024-06-15 Price Changed $188,000 OneKey® MLS as Distributed by MLS Grid
- 2024-06-15 Relisted — OneKey® MLS as Distributed by MLS Grid
- 2024-06-06 Listing Removed — OneKey® MLS as Distributed by MLS Grid
- 2023-08-30 Listed $199,900 OneKey® MLS as Distributed by MLS Grid
Property tax history
-0.2%/yrLatest (2025): $1,339 · +1.0% YoY. Source: county tax records.
Cash-flow waterfall
monthlySold comps — $/sqft
last 12 mo · ≤1 miLoading sold comps…