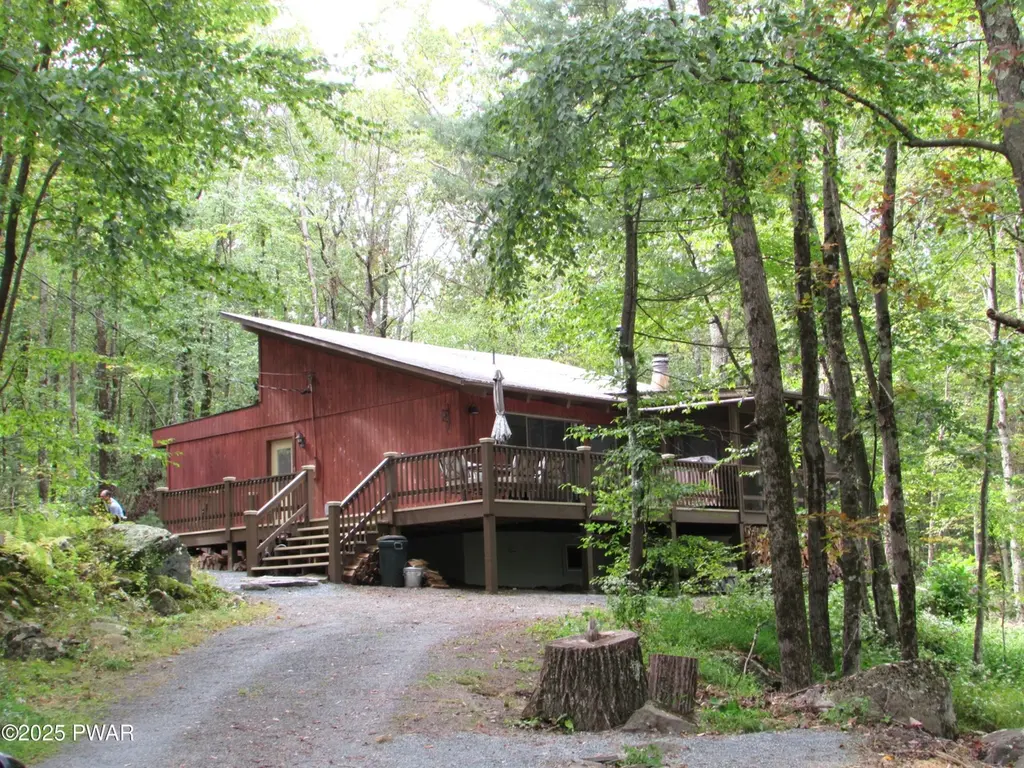
124 Hickory Dr
Hemlock Farms, PA 18428
$249,000A
3 bd · 1.0 ba ·
1,024 sqft ·
Built 1972
· SingleFamily
· Active
· 11 DOM
Cashflow @ list (25.0% down · 7.5%)
Estimated rent
$3,681/mo
Mortgage (P&I)
−$1,306
Tax + insurance
−$306
HOA
−$250
Vac / Maint / Mgmt
−$773
Net cashflow
$1,047/mo
Annual
$12,561/yr
Cap rate
11.34%
Cash-on-cash
18.02%
DSCR
1.80
1% rule
1.48%
Cash to close
$69,720
Investor read
- This is a 3-bed/1.0-bath single-family listed at $249k.
- At list price, monthly cash flow is $1k ($13k/yr) — positive.
- The deal already cash-flows at list — no discount required.
- Meets the 1% rule at list price ($4k rent vs $249k).
- Only 11 days on market — expect competitive offers; lowballing is unlikely to land.
- In year one you build about $27k of equity ($2k loan paydown + $25k appreciation (10.0% local appreciation)).
- Location reads 68/100 on livability (#884 in PA) — a middle-class / working-renter tenant base. Strengths: crime A+, housing A+, health & safety A+; Watch: amenities F, commute F.
- Wallenpaupack Area SD (rural): math 39% / reading 59% proficiency, ranked #192 of 539 in PA (top 36%) — families likely to look elsewhere, expect single-tenant / working-renter base with shorter leases.
- Zoned schools: Wallenpaupack South El Sch (math 47% / reading 52%, grade D, #654 of 1,518 statewide, top 47%, 255 students, 72% FRL); Wallenpaupack Area Ms (math 23% / reading 57%, grade F, #257 of 512 statewide, top 52%, 644 students, 59% FRL); Wallenpaupack Area Hs (math 74% / reading 67%, grade B+, #48 of 437 statewide, top 11%, 990 students, 62% FRL) — zoned schools average 64% FRL vs 44% district-wide (21 pts higher); higher-poverty schools than district average — tighter screening recommended.
- Market conditions: 375 active listings in the ZIP; 2 comparable units currently listed for rent nearby; 213 units permitted in Pike County in 2024 (0 in 5+ unit buildings).
- Pike County population projected at -25% by 2050 — secular population decline; favor cash flow + early exit over multi-decade hold.
- 6 sale attempts since 7y ago with the ask held roughly flat each time — persistent listings suggest the price (not the market) is what's stuck; bring a comps-based counter.
- Current owner paid $65k; list at $249k implies a 283% gain — meaningful room to come down on a strong offer.
- At projected returns (10.0% appreciation + 3.0% rent growth), your $70k cash investment doubles in ~2 years — after that, you're playing with house money.
- By year 2, paydown + projected appreciation supports a ~$43k cash-out refi (75% LTV) — recoverable capital for the next deal without selling this one.
- Climate carrying-cost: moderate wildfire risk — expect insurance premiums to compound above CPI over the hold.
- Cap rate 11.3% vs local median 6.9% in Hemlock Farms — top-decile yield for the area; either an underpriced asset or a hidden risk that comps aren't pricing in. Stress-test before assuming the spread holds.
Questions for listing agent
- Built in 1972 — when were the roof, HVAC, electrical panel, plumbing, and water heater last replaced?
- What does the HOA fee cover, when was the last increase, and are there any pending special assessments or reserve-fund shortfalls?
- Is there a deadline driving the sale (1031 exchange, divorce, estate, relocation)? That informs how much negotiation room exists.
- What's the average days-on-market for RENTAL listings here right now (not sales)? A rising rental-DOM trend means longer vacancies and softer asking-rent achievability than the comps imply.
- What's the recent tenant-quality profile in this submarket — average credit score on applications, eviction rate, late-payment / NSF rate, and stable-employment percentage? A property-management company in the area should have these aggregated.
- How much new for-sale + rental construction is in the pipeline within 1–3 miles? Heavy new supply typically softens prices + rents 12–24 months out; constrained supply supports both.
CashFlowRE · CFR-5XHNA66BR1GAQN
· Data 1 day ago
cashflowre.app · 2026-05-29