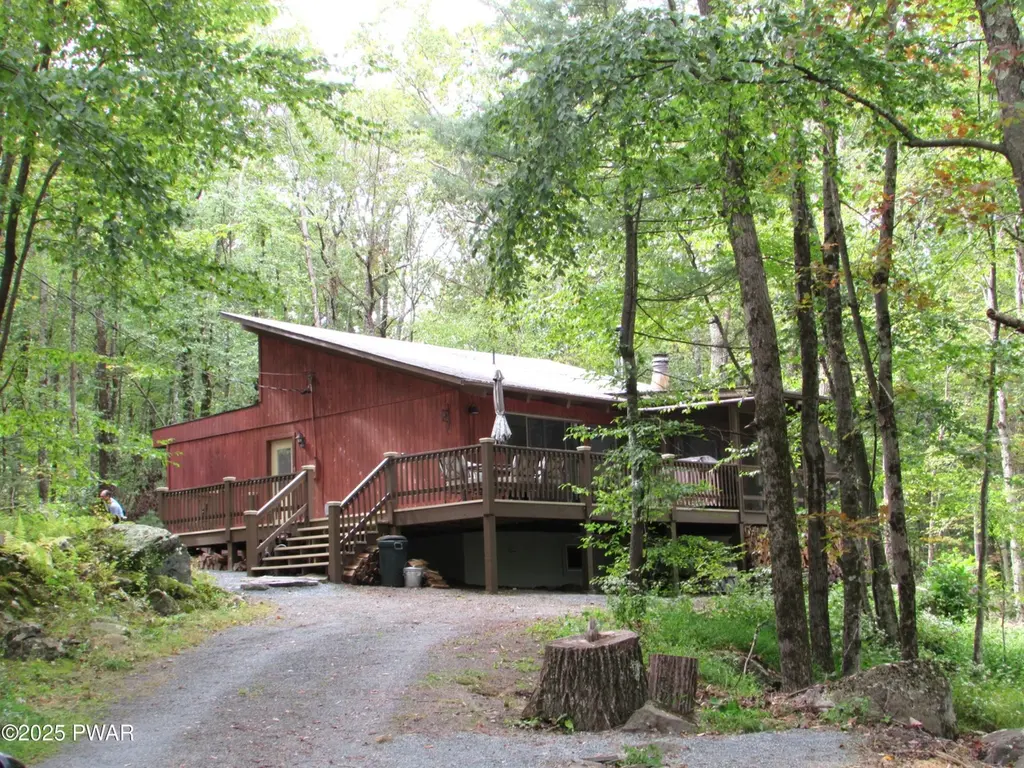
124 Hickory Dr · Hemlock Farms, PA
Flood risk 1/10 · Minimal
- FEMA flood zone
- X (unshaded)
- Chance of flooding over 30 yrs
- 0.0%
- Est. flood insurance / yr
- $473 – $860
Fire risk 5/10 · Moderate
- Est. fire insurance / yr
- $511 – $949
Heat risk 2/10 · Minimal
- Hot days now (above 91°F)
- 7 days/yr
- Hot days in 30 yrs
- 15 days/yr
Wind risk 3/10 · Minor
- Chance of severe wind over 30 yrs
- 6.0%
Air-quality risk 2/10 · Minimal
- Unhealthy air days now
- 1 days/yr
- Unhealthy air days in 30 yrs
- 2 days/yr
Risk factors via First Street. Map © Google.
Why this score? — see what drove the A grade
The composite is a weighted blend of 9 inputs, each scored 0–100. Each bar is that input's sub-score; the figure is the points it added to the 100-point composite (weight × sub-score).
- Cash flow +30.0/30.0
- ARV discount +14.2/15.0
- DSCR +10.0/10.0
- Appreciation +10.0/10.0
- 1% rule +9.8/10.0
- Schools +4.2/10.0
- Livability +3.4/5.0
- Rent growth +2.5/5.0
- Condition / age +2.5/5.0
$249,000
🖨 Deal sheet (PDF) 📄 Offer letter ✓ Due diligence
Listing remarks
UPDATED MODERN RANCH WITH A STUNNING STONE FIREPLACE, PRIVACY, AND RUSTIC CHARM! LOW TAXES - JUST UNDER $2500 PER YEAR! Schedule your private showing today! Thoughtfully renovated throughout, this exceptional property features new interior walls, updated siding, windows, and doors, creating a fresh, inviting atmosphere while preserving its warm mountain character. The stunning stone fireplace serves as the centerpiece of the living space, complemented by an additional wood stove that adds both charm and comfort. Enjoy the beauty of the outdoors from the screened-in porch or entertain guests on the expansive deck surrounded by nature. The finished basement offers valuable additional livin
Key facts
- Screened-in porch
- Gated lake community
- Newly added bathroom
Tags
Property features AI
Finance
- Other: Community amenities include lake access and fishing
- HOA & community: Part of a homeowners association (Hemlock Farms); Annual association fee (listed); Association features include pool(s), indoor pool, clubhouse, fitness center, tennis courts, basketball court, playground, trails, park, dog park, gated access, security, maintenance of grounds, trash service, snow removal, beach rights
Exterior
- Parking: Driveway
- Security: 24-hour security; Gated community
- Utilities: 200+ amp electrical service; Septic system
- Home design: Single-family residence; Two levels
- Construction: Asphalt roof
- Exterior features: Deck (enclosed, wrap-around); Sloped, wooded lot with views; Access to a community lake
Interior
- Kitchen: Electric range/oven; Microwave; Refrigerator
- Bedrooms: Total of 5 rooms (see floor plan for bedroom configuration)
- Flooring: Hardwood; Tile
- Bathrooms: 2 full bathrooms
- Heating & cooling: Baseboard heating; Zoned heating; Wood stove; Electric heating; Fireplace heating; No central air
- Interior features: Cathedral ceilings; Open floor plan; Double-pane windows; Finished basement; Two wood-burning fireplaces with stone surrounds (one in the living room)
- Laundry & utility: Washer and dryer (laundry on lower level)
Neighborhood map
What this means for you Summary
Snapshot
- This is a 3-bed/1.0-bath single-family listed at $249k.
Deal economics
- At list price, monthly cash flow is $1k ($13k/yr) — positive.
- The deal already cash-flows at list — no discount required.
- Meets the 1% rule at list price ($4k rent vs $249k).
- Cap rate 11.3% vs local median 6.9% in Hemlock Farms — top-decile yield for the area; either an underpriced asset or a hidden risk that comps aren't pricing in. Stress-test before assuming the spread holds.
Location & tenants
- Location reads 68/100 on livability (#884 in PA) — a middle-class / working-renter tenant base. Strengths: crime A+, housing A+, health & safety A+; Watch: amenities F, commute F.
- Wallenpaupack Area SD (rural): math 39% / reading 59% proficiency, ranked #192 of 539 in PA (top 36%) — families likely to look elsewhere, expect single-tenant / working-renter base with shorter leases.
- Zoned schools: Wallenpaupack South El Sch (math 47% / reading 52%, grade D, #654 of 1,518 statewide, top 47%, 255 students, 72% FRL); Wallenpaupack Area Ms (math 23% / reading 57%, grade F, #257 of 512 statewide, top 52%, 644 students, 59% FRL); Wallenpaupack Area Hs (math 74% / reading 67%, grade B+, #48 of 437 statewide, top 11%, 990 students, 62% FRL) — zoned schools average 64% FRL vs 44% district-wide (21 pts higher); higher-poverty schools than district average — tighter screening recommended.
- Market conditions: 375 active listings in the ZIP; 2 comparable units currently listed for rent nearby; 213 units permitted in Pike County in 2024 (0 in 5+ unit buildings).
Forward outlook
- In year one you build about $27k of equity ($2k loan paydown + $25k appreciation (10.0% local appreciation)).
- Pike County population projected at -25% by 2050 — secular population decline; favor cash flow + early exit over multi-decade hold.
- At projected returns (10.0% appreciation + 3.0% rent growth), your $70k cash investment doubles in ~2 years — after that, you're playing with house money.
- By year 2, paydown + projected appreciation supports a ~$43k cash-out refi (75% LTV) — recoverable capital for the next deal without selling this one.
Negotiation context
- Only 11 days on market — expect competitive offers; lowballing is unlikely to land.
- 6 sale attempts since 7y ago with the ask held roughly flat each time — persistent listings suggest the price (not the market) is what's stuck; bring a comps-based counter.
- Current owner paid $65k; list at $249k implies a 283% gain — meaningful room to come down on a strong offer.
Risks & watch-outs
- Climate carrying-cost: moderate wildfire risk — expect insurance premiums to compound above CPI over the hold.
Questions for the listing agent
- Built in 1972 — when were the roof, HVAC, electrical panel, plumbing, and water heater last replaced?
- What does the HOA fee cover, when was the last increase, and are there any pending special assessments or reserve-fund shortfalls?
- Is there a deadline driving the sale (1031 exchange, divorce, estate, relocation)? That informs how much negotiation room exists.
- What's the average days-on-market for RENTAL listings here right now (not sales)? A rising rental-DOM trend means longer vacancies and softer asking-rent achievability than the comps imply.
- What's the recent tenant-quality profile in this submarket — average credit score on applications, eviction rate, late-payment / NSF rate, and stable-employment percentage? A property-management company in the area should have these aggregated.
- How much new for-sale + rental construction is in the pipeline within 1–3 miles? Heavy new supply typically softens prices + rents 12–24 months out; constrained supply supports both.
Investment metrics
- 1% rule
- 1.48% ✓
- Cap rate
- 11.34%
- Cash-on-cash
- 18.02%
- DSCR
- 1.80
- GRM
- 5.6
CMA / ARV
- ARV (median comp)
- $292,521
- List price
- $249,000
- Delta
- -14.88%
- Verdict
- UNDERPRICED
- Comps
- 20 within 1.0 mi
Show comp detail 11 sales within ~0.75 mi
| Address | Dist | Beds/Ba | Sqft | Sold | Price | $/sf | Match |
|---|---|---|---|---|---|---|---|
| 404 Forest Dr | 0.07mi | 3/1.0 | 1,085 (+6%) | 6mo | $270,000 | $249 | 82 |
| 104 Ironwood Ln | 0.35mi | 3/2.0 | 1,032 (+1%) | 14mo | $260,000 | $252 | 67 |
| 806 Rimrock Ct | 0.45mi | 3/2.0 | 1,142 (+12%) | 4mo | $300,000 | $263 | 53 |
| 111 Blueridge Ln | 0.37mi | 3/1.0 | 1,176 (+15%) | 9mo | $215,000 | $183 | 51 |
| 807 Rimrock Ct | 0.44mi | 2/1.5 (-1) | 1,080 (+6%) | 17mo | $225,000 | $208 | 49 |
| 107 Ridgeway Dr | 0.62mi | 3/2.0 | 1,083 (+6%) | 11mo | $257,500 | $238 | 49 |
| 323 Forest Dr | 0.13mi | 2/1.0 (-1) | 872 (-15%) | 23mo | $230,000 | $264 | 45 |
| 100 Saddlebrook Ln | 0.54mi | 2/1.0 (-1) | 912 (-11%) | 11mo | $235,000 | $258 | 42 |
| 104 Longspur Ln | 0.75mi | 3/1.5 | 1,080 (+6%) | 18mo | $295,000 | $273 | 38 |
| 126 Rockwood Dr | 0.63mi | 2/1.0 (-1) | 885 (-14%) | 19mo | $169,000 | $191 | 27 |
| 138 Long Ridge Dr | 0.66mi | 2/1.0 (-1) | 1,152 (+12%) | 21mo | $240,000 | $208 | 26 |
Match score weights: distance 35% · size 25% · config 20% · recency 20%. Top-matched comps best support the ARV.
Projected returns pro-forma
10.0% appreciation · 3.0% rent growth · sell at horizon
- IRR
- 37.7%
- Equity multiple
- 3.90×
- Total profit
- $202,423
- Equity at exit
- $224,319
- IRR
- 32.5%
- Equity multiple
- 8.80×
- Total profit
- $543,957
- Equity at exit
- $483,752
Cash invested: $69,720 (down + closing). Projections, not guarantees.
Landlord ↔ Tenant lean methodology
- Overall (STATE)
- 62 Landlord-Friendly
- State Pennsylvania
- 62 Landlord-Friendly · EVEN
- County
- — inherits STATE
- City
- — inherits STATE
ZIP-level market 18428
- Home prices YoY
- 9.2%
- Active inventory
- 375
- Price-to-rent
- 5.6×
Monthly cashflow live
- Estimated rent
- $3,681 medium interval (Pro) →
- Mortgage (P&I)
- −$1,306
- Tax from tax record
- −$202 /mo · $2,422/yr
- Insurance
- −$104
- HOA
- −$250
- Vacancy / Maint / Mgmt
- −$773
- Net cashflow
- $1,047
Break-even live
Sensitivity live
| Price | -10% $1,188 | -5% $1,117 | +0% $1,047 | +5% $976 | +10% $906 |
|---|---|---|---|---|---|
| Rent | -10% $756 | -5% $901 | +0% $1,047 | +5% $1,192 | +10% $1,338 |
| Rate | -1.0pp $1,172 | -0.5pp $1,110 | base $1,047 | +0.5pp $982 | +1.0pp $917 |
UW: 25.0% down · 7.5% · 30yr · 1.5% tax · 5.0% vac · 8.0% maint · 8.0% mgmt
Financing live
Cash to close
- Down payment
- $62,250
- Closing costs
- $7,470
- Reserves months
- —
- Total cash needed
- —
Loan-product check · same deal, 3 products live
Conventional
25% down · 7.5% · 30yr
- Down + closing
- —
- Monthly P&I
- —
- Monthly cashflow
- —
- DSCR
- —
- Eligible?
- —
Personal DTI + credit; lowest rate.
DSCR
20% down · 8.5% · 30yr
- Down + closing
- —
- Monthly P&I
- —
- Monthly cashflow
- —
- DSCR
- —
- Eligible?
- —
No personal income docs; deal must DSCR.
Hard money
10% down · 12.0% · 12mo
- Down + closing
- —
- Monthly P&I
- —
- Monthly cashflow
- —
- DSCR
- —
- Eligible?
- —
Short-term bridge; refi at stabilization.
Rent comps 2 comps
| Address | Beds | Baths | Sqft | Rent | $/sqft | DOM | Units | Dist |
|---|---|---|---|---|---|---|---|---|
| 313 Forest Dr Blooming Grove, PA | 3.0 | 2.0 | 1200 | $4,600 | $3.83 | 0d | 1 | 0.25mi |
| 811 Hickory Ct Hawley, PA | 3.0 | 2.0 | 1100 | $2,500 | $2.27 | 0d | 1 | 0.36mi |
HOA detail
- Monthly dues
- $250 · $3,000/yr
Listing history 20 events
-
2026-06-21days on market $249,000 Active 11 DOM
-
2026-06-18days on market $249,000 Active 8 DOM
-
2026-06-17days on market $249,000 Active 7 DOM
-
2026-06-16days on market $249,000 Active 6 DOM
-
2026-06-15days on market $249,000 Active 5 DOM
-
2026-06-13days on market $249,000 Active 3 DOM
-
2026-06-13remarks 699-char remark
-
2026-06-13statusdays on market $249,000 Active 2 DOM
-
2026-05-15status Pending 472-char remark
-
2026-04-23price $249,000 472-char remark
-
2026-04-10price $267,000 472-char remark
-
2026-03-08$269,000 Active 472-char remark
-
2025-09-10$299,000 Active
-
2020-03-05soldstatus $65,000
-
2020-02-01soldstatus $65,000
-
2020-02-01soldstatus $65,000
-
2020-02-01soldstatus
-
2019-04-06$65,000
-
2019-04-06$65,000
-
2019-04-06$65,000
ⓘ Source: listings_history table (triggers on properties + properties_extension) + one-shot
backfill from property_details.listing_events for pre-trigger history.
Tax reassessment forecast PA · Partial reset (capped growth)
- Current annual tax
- $2,422 · $202/mo
- Projected year-2 tax
- $3,178 · $265/mo
- Expected delta
- +$756/yr (+$63/mo · 31.2%)
ⓘ Screening estimate from a state-policy table — verify with the county assessor before closing.
Climate risk First Street
- Flood 1/10 Low FEMA zone X (unshaded) · 0% chance over 30 yrs
- Wildfire 5/10 Major
- Heat 2/10 Low 7 d/yr ≥91°F today · 15 d/yr by 30 yrs out
- Wind 3/10 Moderate 6% chance of damaging wind over 30 yrs
- Air quality 2/10 Low 1 unhealthy d/yr today · 2 by 30 yrs out
Nearby sold comps map
Loading sold comps map…
Walkable amenities ~0.75 mi
Loading nearby amenities…
Taxation est. · year 1
- Rental income
- $44,174
- − Mortgage interest
- −$13,948
- − Property taxes
- −$2,422
- − Insurance
- −$1,245
- − Repairs & maintenance
- −$3,534
- − Management
- −$3,534
- − HOA
- −$3,000
- − Depreciation
- −$7,244
- Taxable income
- $9,248
- Est. tax owed @ 24.0%
- −$2,219
- After-tax cash flow
- $10,342/yr
For passive investors: Depreciation is non-cash, so a rental often shows a tax loss while cash-flowing — sheltering income. Rental losses are passive: they offset passive income freely, and up to $25,000/yr can offset ordinary (W-2) income if you actively participate and your MAGI is under $100k (phasing out to $0 by $150k); unused losses carry forward. On sale, claimed depreciation is recaptured at up to 25%, and gains may owe capital-gains tax (a 1031 exchange can defer both). Figures are a year-1 estimate at your 24.0% rate — not tax advice; consult a CPA.
Schools (NCES district)
- District
- Wallenpaupack Area SD
- NCES district ID
- 4224750
- Math proficiency
- 39% ▼ -10.00%
- Reading proficiency
- 59% ▼ -5.00%
- Median HH income
- $51,027
- Composite
- 41.97/100
- National rank
- #3345
- State rank
- #192 of 539 in PA
Livability — Hemlock Farms
- Score
- 68/100
- State rank
- #884
- US rank
- #9421
Category grades
Schools grade is shown separately in the Schools card above.
Census & demographics
- Census place
- Hemlock Farms, PA
- Population (ZIP)
- 12,446
Population outlook (Pike County) Hauer SSP2
- Today (2025)
- 53,548 people
- By 2030
- 51,622 · -3.6%
- By 2040
- 46,490 · -13.2%
- By 2050
- 40,372 · -24.6%
- By 2075
- 31,951 · -40.3%
- By 2100
- 26,821 · -49.9%
Race, ethnicity, and origin ACS 2023
- Neighborhood character
- Predominantly White (85%)
- Race & ethnicity
- White 85% Hispanic / Latino 8% Two or more races 6% Black 1% Asian 1%
- Hispanic origin (detail)
- Puerto Rican 5%
- Common ancestry
- Romanian 5% Portuguese 3% Italian 2%
- Foreign-born
- 5% · Canada
- Languages at home
- 91% English-only · Spanish 5% Russian/Polish/Slavic 1% Other Asian/Pacific 1%
Political lean MEDSL · Pike
- 2024 margin
- Strong R (+24.1) · D 37.6% · R 61.6%
- 2008→2024 swing
- -19.8pp toward R · 2008: -4.2pp · 2024: -24.1pp
- All cycles
- 2024: R+24.1 2020: R+19.0 2016: R+26.0 2012: R+11.0 2008: R+4.2
Not yet ingested
- Civics
- —
Market trends
- HPI YoY
- ▲ 28.60%
- Current HPI
- 340.8254
- Rent YoY
- —
- Metro
- —
- State GDP YoY
- ▲ 1.68%
- F500 in state
- 34
Industry mix (Fortune 500 HQ in PA)
| Industry | F500 HQs | Revenue |
|---|---|---|
| Healthcare | 2 | $309B |
|
||
| Insurance | 2 | $27B |
|
||
| Telecommunications / Media | 1 | $124B |
|
||
| Industrial Distribution | 1 | $22B |
|
||
| Financial Services | 1 | $20B |
|
||
| Chemicals / Materials | 1 | $18B |
|
||
Price history
+283.1% since first listed13 events — show timeline
- 2026-06-10 Listed $249,000 PWMLS
- 2026-05-15 Pending — PWMLS
- 2026-04-23 Price Changed $249,000 PWMLS
- 2026-04-10 Price Changed $267,000 PWMLS
- 2026-03-08 Listed $269,000 PWMLS
- 2025-09-10 Listed $299,000 PWMLS
- 2020-03-05 Sold (Public Records) $65,000 Public Records
- 2020-02-01 Sold (MLS) — PWMLS
- 2020-02-01 Sold (MLS) $65,000 PWMLS
- 2020-02-01 Sold (MLS) $65,000 PWMLS
- 2019-04-06 Listed $65,000 PWMLS
- 2019-04-06 Listed $65,000 PWMLS
- 2019-04-06 Listed $65,000 PWMLS
Property tax history
+2.8%/yrLatest (2026): $2,422 · +3.0% YoY. Source: county tax records.
Cash-flow waterfall
monthlySold comps — $/sqft
last 12 mo · ≤1 miLoading sold comps…