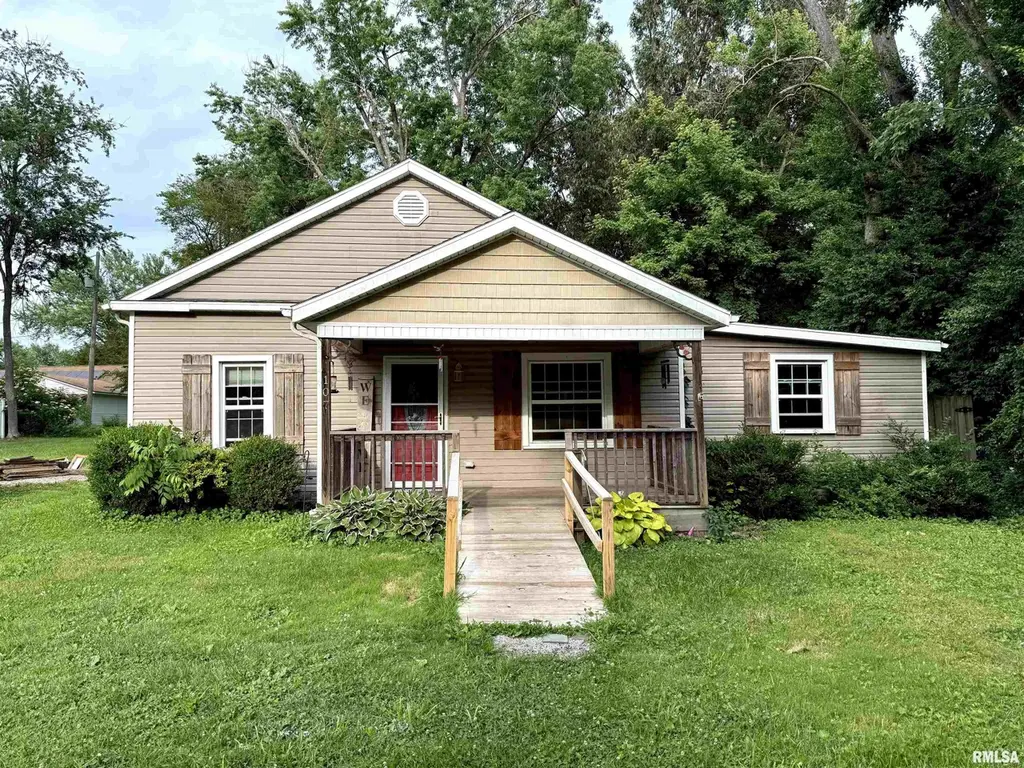
107 Bevard St
Cambria, IL 62915
$84,999B-
2 bd · 2.0 ba ·
1,247 sqft ·
Built 1924
· SingleFamily
· Active
· 14 DOM
Cashflow @ list (25.0% down · 7.5%)
Estimated rent
$926/mo
Mortgage (P&I)
−$446
Tax + insurance
−$111
HOA
−$0
Vac / Maint / Mgmt
−$195
Net cashflow
$175/mo
Annual
$2,096/yr
Cap rate
8.76%
Cash-on-cash
8.81%
DSCR
1.39
1% rule
1.09%
Cash to close
$23,800
Investor read
- This is a 2-bed/2.0-bath single-family listed at $85k.
- At list price, monthly cash flow is $175 ($2k/yr) — positive.
- The deal already cash-flows at list — no discount required.
- Meets the 1% rule at list price ($926 rent vs $85k).
- Only 14 days on market — expect competitive offers; lowballing is unlikely to land.
- In year one you build about $3k of equity ($587 loan paydown + $3k appreciation (3.0% local appreciation)).
- Location reads 61/100 on livability (#931 in IL) — a middle-class / working-renter tenant base. Strengths: crime A+, cost of living A+, housing A+; Watch: amenities F, commute F, employment F.
- Carterville CUSD 5 (suburban): math 29% / reading 43% proficiency, ranked #185 of 620 in IL (top 30%) — families likely to look elsewhere, expect single-tenant / working-renter base with shorter leases.
- Zoned schools: Carterville Jr High Sch (math 29% / reading 45%, grade F, #167 of 665 statewide, top 27%, 363 students, 0% FRL); Carterville High School (math 37% / reading 42%, grade F, #88 of 693 statewide, top 14%, 636 students, 0% FRL) — zoned schools average 0% FRL vs 34% district-wide (34 pts lower); this property's tenant base skews higher-income than the district average.
- Watch-outs: built in 1924 — expect roof / HVAC / electrical / plumbing capex.
- Market conditions: 7 active listings in the ZIP; 130 units permitted in Williamson County in 2024 (5 in 5+ unit buildings).
- At projected returns (3.0% appreciation + 3.0% rent growth), your $24k cash investment doubles in ~5 years — after that, you're playing with house money.
- By year 10, paydown + projected appreciation supports a ~$30k cash-out refi (75% LTV) — recoverable capital for the next deal without selling this one.
- Cap rate 8.8% vs local median 2.6% in Cambria — top-decile yield for the area; either an underpriced asset or a hidden risk that comps aren't pricing in. Stress-test before assuming the spread holds.
Questions for listing agent
- Built in 1924 — when were the roof, HVAC, electrical panel, plumbing, and water heater last replaced?
- Is there a deadline driving the sale (1031 exchange, divorce, estate, relocation)? That informs how much negotiation room exists.
- Schools are F-rated, which usually means shorter tenancies and higher turnover. Who's the typical renter profile here, and what's been the actual vacancy rate?
- What's the average days-on-market for RENTAL listings here right now (not sales)? A rising rental-DOM trend means longer vacancies and softer asking-rent achievability than the comps imply.
- What's the recent tenant-quality profile in this submarket — average credit score on applications, eviction rate, late-payment / NSF rate, and stable-employment percentage? A property-management company in the area should have these aggregated.
- How much new for-sale + rental construction is in the pipeline within 1–3 miles? Heavy new supply typically softens prices + rents 12–24 months out; constrained supply supports both.
CashFlowRE · CFR-5Y0J877NAZPXB1
· Data 1 day ago
cashflowre.app · 2026-05-29