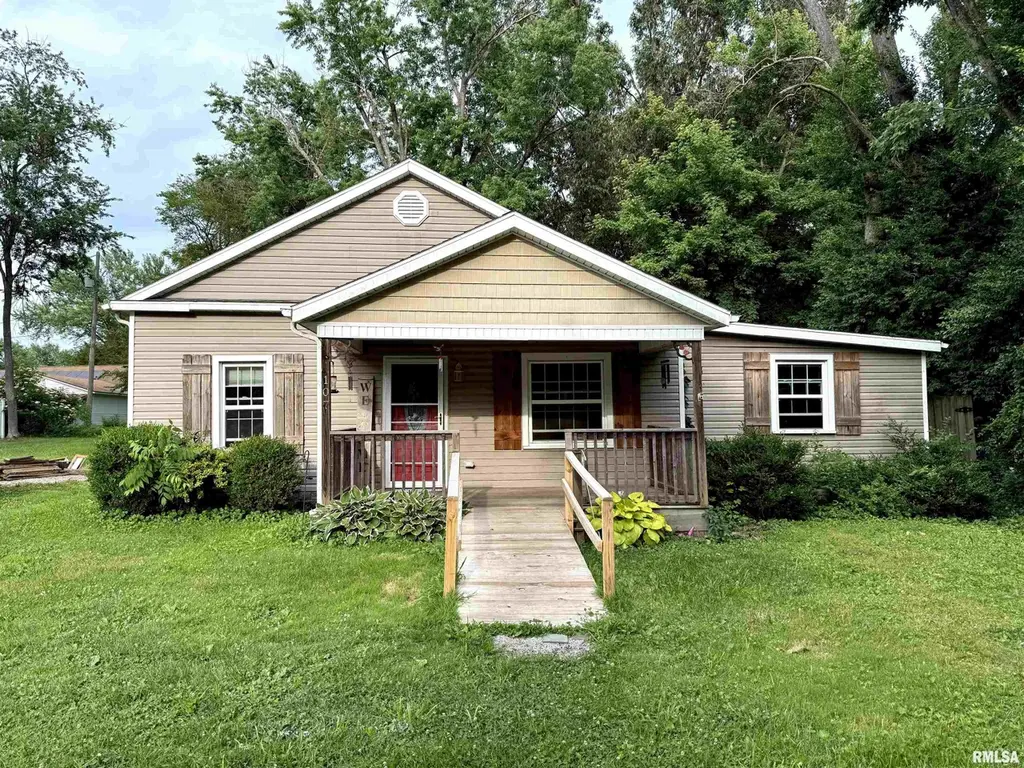
107 Bevard St · Cambria, IL
Flood risk 1/10 · Minimal
- FEMA flood zone
- X (unshaded)
- Chance of flooding over 30 yrs
- 0.0%
- Est. flood insurance / yr
- $473 – $860
Fire risk 2/10 · Minimal
- Est. fire insurance / yr
- $804 – $1,492
Heat risk 4/10 · Minor
- Hot days now (above 107°F)
- 7 days/yr
- Hot days in 30 yrs
- 19 days/yr
Wind risk 2/10 · Minimal
- Chance of severe wind over 30 yrs
- 2.0%
Air-quality risk 2/10 · Minimal
- Unhealthy air days now
- 0 days/yr
- Unhealthy air days in 30 yrs
- 1 days/yr
Risk factors via First Street. Map © Google.
Why this score? — see what drove the B- grade
The composite is a weighted blend of 9 inputs, each scored 0–100. Each bar is that input's sub-score; the figure is the points it added to the 100-point composite (weight × sub-score).
- Cash flow +24.5/30.0
- ARV discount +15.0/15.0
- DSCR +7.9/10.0
- 1% rule +5.9/10.0
- Appreciation +5.0/10.0
- Schools +3.1/10.0
- Livability +3.1/5.0
- Rent growth +2.5/5.0
- Condition / age +2.5/5.0
$84,999
🖨 Deal sheet 📄 Offer letter ✓ Due diligence
Listing remarks
Nestled on a quiet, serene road within the sought-after Carterville School District, this 2-bedroom, 2-bath home offers comfort, space and endless possibilities. Situated on a large double lot, the property provides ample outdoor space for recreation, gardening, expansion opportunities or simply enjoying the peaceful setting. Inside, you'll find generously sized bedrooms and an open, split floor plan that creates a spacious, welcoming atmosphere perfect for everyday living and entertaining. With a little TLC, this property presents an excellent opportunity for first-time buyers, investors or anyone looking to add their personal touch and build equity. Whether you're searching for a starter
Key facts
- Ample outdoor space
- Large double lot
- 0.29 acre lot
Tags
Property features AI
Exterior
- Parking: Gravel, oversized parking (no garage)
- Utilities: Public water; Public sewer
- Home design: Single family residence; Built in 1924
- Construction: Shingle roof; Total building area approx. 1247 (living area listed as 1247)
- Exterior features: Fenced yard; Paved road access; Lot dimensions approx. 125 x 100
Interior
- Kitchen: Kitchen on main level
- Bedrooms: 2 bedrooms (both on the main level; approx. 14.1 x 13.1 and 13.5 x 10.2); Egress windows in bedrooms
- Flooring: Laminate flooring in bedrooms and kitchen
- Bathrooms: 2 full bathrooms
- Heating & cooling: Heat pump heating; Central air conditioning
- Interior features: Refrigerator included; No basement; No fireplaces
- Laundry & utility: Public water and public sewer available
Neighborhood map
What this means for you Summary
Snapshot
- This is a 2-bed/2.0-bath single-family listed at $85k.
Deal economics
- At list price, monthly cash flow is $175 ($2k/yr) — positive.
- The deal already cash-flows at list — no discount required.
- Meets the 1% rule at list price ($926 rent vs $85k).
- Cap rate 8.8% vs local median 2.6% in Cambria — top-decile yield for the area; either an underpriced asset or a hidden risk that comps aren't pricing in. Stress-test before assuming the spread holds.
Location & tenants
- Location reads 61/100 on livability (#931 in IL) — a middle-class / working-renter tenant base. Strengths: crime A+, cost of living A+, housing A+; Watch: amenities F, commute F, employment F.
- Carterville CUSD 5 (suburban): math 29% / reading 43% proficiency, ranked #185 of 620 in IL (top 30%) — families likely to look elsewhere, expect single-tenant / working-renter base with shorter leases.
- Zoned schools: Carterville Jr High Sch (math 29% / reading 45%, grade F, #167 of 665 statewide, top 27%, 363 students, 0% FRL); Carterville High School (math 37% / reading 42%, grade F, #88 of 693 statewide, top 14%, 636 students, 0% FRL) — zoned schools average 0% FRL vs 34% district-wide (34 pts lower); this property's tenant base skews higher-income than the district average.
- Market conditions: 7 active listings in the ZIP; 130 units permitted in Williamson County in 2024 (5 in 5+ unit buildings).
Forward outlook
- In year one you build about $3k of equity ($587 loan paydown + $3k appreciation (3.0% local appreciation)).
- At projected returns (3.0% appreciation + 3.0% rent growth), your $24k cash investment doubles in ~5 years — after that, you're playing with house money.
- By year 10, paydown + projected appreciation supports a ~$30k cash-out refi (75% LTV) — recoverable capital for the next deal without selling this one.
Negotiation context
- Only 14 days on market — expect competitive offers; lowballing is unlikely to land.
Risks & watch-outs
- Watch-outs: built in 1924 — expect roof / HVAC / electrical / plumbing capex.
Questions for the listing agent
- Built in 1924 — when were the roof, HVAC, electrical panel, plumbing, and water heater last replaced?
- Is there a deadline driving the sale (1031 exchange, divorce, estate, relocation)? That informs how much negotiation room exists.
- Schools are F-rated, which usually means shorter tenancies and higher turnover. Who's the typical renter profile here, and what's been the actual vacancy rate?
- What's the average days-on-market for RENTAL listings here right now (not sales)? A rising rental-DOM trend means longer vacancies and softer asking-rent achievability than the comps imply.
- What's the recent tenant-quality profile in this submarket — average credit score on applications, eviction rate, late-payment / NSF rate, and stable-employment percentage? A property-management company in the area should have these aggregated.
- How much new for-sale + rental construction is in the pipeline within 1–3 miles? Heavy new supply typically softens prices + rents 12–24 months out; constrained supply supports both.
Investment metrics
- 1% rule
- 1.09% ✓
- Cap rate
- 8.76%
- Cash-on-cash
- 8.81%
- DSCR
- 1.39
- GRM
- 7.6
CMA / ARV
- ARV (on-the-fly)
- $167,098
- Comps found
- 6
Show comp detail 6 sales within ~0.75 mi
| Address | Dist | Beds/Ba | Sqft | Sold | Price | $/sf | Match |
|---|---|---|---|---|---|---|---|
| 111 Bevard St | 0.04mi | 3/1.0 (+1) | 1,200 (-4%) | 10mo | $155,500 | $130 | 74 |
| 411 N Maple St | 0.29mi | 3/2.0 (+1) | 1,222 (-2%) | 13mo | $89,900 | $74 | 68 |
| 209 Madison St | 0.66mi | 3/2.0 (+1) | 1,300 (+4%) | 2mo | $210,000 | $162 | 56 |
| 507 S Maple St | 0.52mi | 3/2.0 (+1) | 1,173 (-6%) | 9mo | $180,000 | $153 | 53 |
| 614 S Elm | 0.66mi | 3/2.0 (+1) | 1,232 (-1%) | 12mo | $165,000 | $134 | 52 |
| 314 Chestnut St | 0.43mi | 2/1.0 | 1,096 (-12%) | 9mo | $76,000 | $69 | 48 |
Match score weights: distance 35% · size 25% · config 20% · recency 20%. Top-matched comps best support the ARV.
Projected returns pro-forma
3.0% appreciation · 3.0% rent growth · sell at horizon
- IRR
- 15.7%
- Equity multiple
- 1.90×
- Total profit
- $21,357
- Equity at exit
- $38,219
- IRR
- 17.4%
- Equity multiple
- 3.54×
- Total profit
- $60,449
- Equity at exit
- $58,900
Cash invested: $23,800 (down + closing). Projections, not guarantees.
Landlord ↔ Tenant lean methodology
- Overall (STATE)
- 43 Moderately Tenant-Leaning
- State Illinois
- 43 Moderately Tenant-Leaning · D+7
- County
- — inherits STATE
- City
- — inherits STATE
ZIP-level market 62915
- Active inventory
- 7
- Price-to-rent
- 7.6×
Monthly cashflow live
- Estimated rent
- $926 medium interval (Pro) →
- Mortgage (P&I)
- −$446
- Tax from tax record
- −$76 /mo · $913/yr
- Insurance
- −$35
- HOA
- −$0
- Vacancy / Maint / Mgmt
- −$195
- Net cashflow
- $175
Break-even live
UW: 25.0% down · 7.5% · 30yr · 1.5% tax · 5.0% vac · 8.0% maint · 8.0% mgmt
Financing live
Cash to close
- Down payment
- $21,250
- Closing costs
- $2,550
- Reserves months
- —
- Total cash needed
- —
Loan-product check · same deal, 3 products live
Conventional
25% down · 7.5% · 30yr
- Down + closing
- —
- Monthly P&I
- —
- Monthly cashflow
- —
- DSCR
- —
- Eligible?
- —
Personal DTI + credit; lowest rate.
DSCR
20% down · 8.5% · 30yr
- Down + closing
- —
- Monthly P&I
- —
- Monthly cashflow
- —
- DSCR
- —
- Eligible?
- —
No personal income docs; deal must DSCR.
Hard money
10% down · 12.0% · 12mo
- Down + closing
- —
- Monthly P&I
- —
- Monthly cashflow
- —
- DSCR
- —
- Eligible?
- —
Short-term bridge; refi at stabilization.
Listing history 12 events
-
2026-06-19days on market $84,999 Active 14 DOM
-
2026-06-18days on market $84,999 Active 13 DOM
-
2026-06-17days on market $84,999 Active 12 DOM
-
2026-06-16days on market $84,999 Active 11 DOM
-
2026-06-15days on market $84,999 Active 10 DOM
-
2026-06-14days on market $84,999 Active 8 DOM
-
2026-06-13days on market $84,999 Active 7 DOM
-
2026-06-10days on market $84,999 Active 5 DOM
-
2026-06-09days on market $84,999 Active 4 DOM
-
2026-06-08days on market $84,999 Active 3 DOM
-
2026-06-07remarks 699-char remark
-
2026-06-07$84,999 Active 2 DOM
ⓘ Source: listings_history table (triggers on properties + properties_extension) + one-shot
backfill from property_details.listing_events for pre-trigger history.
Tax reassessment forecast IL · Partial reset (capped growth)
- Current annual tax
- $913 · $76/mo
- Projected year-2 tax
- $1,421 · $118/mo
- Expected delta
- +$508/yr (+$42/mo · 55.7%)
ⓘ Screening estimate from a state-policy table — verify with the county assessor before closing.
Climate risk First Street
- Flood 1/10 Low FEMA zone X (unshaded) · 0% chance over 30 yrs
- Wildfire 2/10 Low
- Heat 4/10 Moderate 7 d/yr ≥107°F today · 19 d/yr by 30 yrs out
- Wind 2/10 Low 2% chance of damaging wind over 30 yrs
- Air quality 2/10 Low 0 unhealthy d/yr today · 1 by 30 yrs out
Nearby sold comps map
Loading sold comps map…
Walkable amenities ~0.75 mi
Loading nearby amenities…
Taxation est. · year 1
- Rental income
- $11,117
- − Mortgage interest
- −$4,761
- − Property taxes
- −$913
- − Insurance
- −$425
- − Repairs & maintenance
- −$889
- − Management
- −$889
- − Depreciation
- −$2,473
- Taxable income
- $766
- Est. tax owed @ 24.0%
- −$184
- After-tax cash flow
- $1,912/yr
For passive investors: Depreciation is non-cash, so a rental often shows a tax loss while cash-flowing — sheltering income. Rental losses are passive: they offset passive income freely, and up to $25,000/yr can offset ordinary (W-2) income if you actively participate and your MAGI is under $100k (phasing out to $0 by $150k); unused losses carry forward. On sale, claimed depreciation is recaptured at up to 25%, and gains may owe capital-gains tax (a 1031 exchange can defer both). Figures are a year-1 estimate at your 24.0% rate — not tax advice; consult a CPA.
Schools (NCES district)
- District
- Carterville CUSD 5
- NCES district ID
- 1708640
- Math proficiency
- 29% ▼ -16.00%
- Reading proficiency
- 43% ▼ -18.00%
- Median HH income
- $47,344
- Composite
- 30.87/100
- National rank
- #6122
- State rank
- #185 of 620 in IL
Livability — Cambria
- Score
- 61/100
- State rank
- #931
- US rank
- #18092
Category grades
Schools grade is shown separately in the Schools card above.
Census & demographics
- Census place
- Cambria, IL
- City population
- 473
- Population (ZIP)
- 473
Population outlook (Williamson County) Hauer SSP2
- Today (2025)
- 69,553 people
- By 2030
- 70,090 · +0.8%
- By 2040
- 70,345 · +1.1%
- By 2050
- 69,394 · -0.2%
- By 2075
- 63,590 · -8.6%
- By 2100
- 51,154 · -26.5%
Race, ethnicity, and origin ACS 2023
- Neighborhood character
- Predominantly White (81%)
- Race & ethnicity
- White 81% Two or more races 13% Hispanic / Latino 12% Black 2%
- Hispanic origin (detail)
- Mexican 12%
- Common ancestry
- Romanian 6%
- Foreign-born
- 4% · Canada
- Languages at home
- 96% English-only · Spanish 4%
Political lean MEDSL · Williamson
- 2024 margin
- Solid R (+38.8) · D 30.0% · R 68.8% · Other 1.3%
- 2008→2024 swing
- -24.0pp toward R · 2008: -14.8pp · 2024: -38.8pp
- All cycles
- 2024: R+38.8 2020: R+37.3 2016: R+41.2 2012: R+25.0 2008: R+14.8
Not yet ingested
- Civics
- —
Market trends
- HPI YoY
- —
- Current HPI
- —
- Rent YoY
- —
- Metro
- —
- State GDP YoY
- ▲ 1.59%
- F500 in state
- 60
Industry mix (Fortune 500 HQ in IL)
| Industry | F500 HQs | Revenue |
|---|---|---|
| Insurance | 4 | $201B |
|
||
| Consumer Goods | 4 | $87B |
|
||
| Industrial Machinery | 3 | $64B |
|
||
| Healthcare | 2 | $55B |
|
||
| Retail / Pharmacy | 1 | $148B |
|
||
| Agriculture / Food | 1 | $86B |
|
||
Price history
1 event — show timeline
- 2026-06-05 Listed $84,999 RMLSA as Distributed by MLS Grid
Property tax history
+9.7%/yrLatest (2025): $913 · +72.1% YoY. Source: county tax records.
Cash-flow waterfall
monthlySold comps — $/sqft
last 12 mo · ≤1 miLoading sold comps…