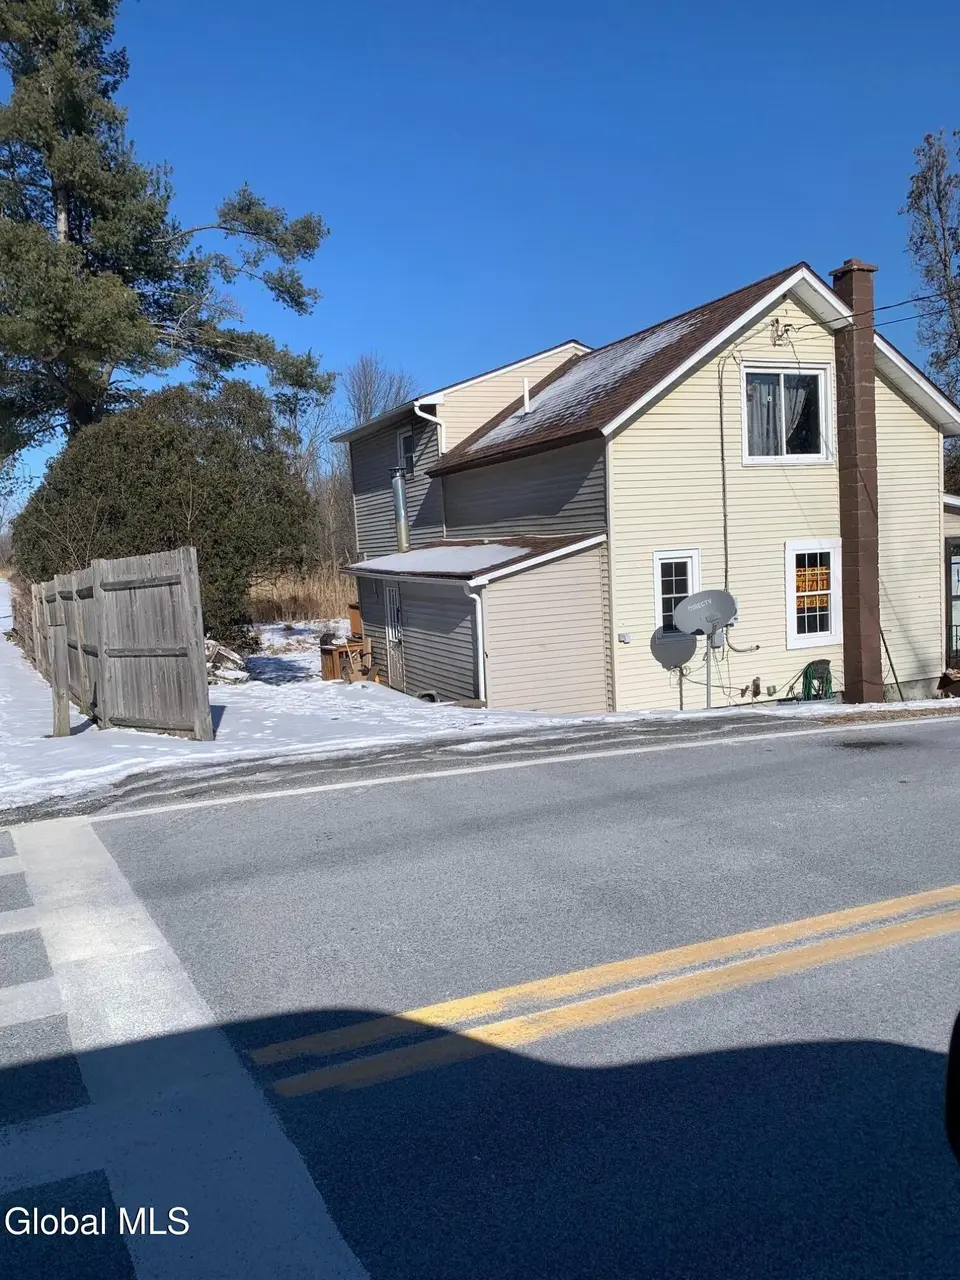
9 Lower Newtown Rd
Waterford, NY 12188
$159,900B
4 bd · 2.0 ba ·
1,447 sqft ·
Built 1926
· SingleFamily
· Pending
· 4 DOM
Cashflow @ list (25.0% down · 7.5%)
Estimated rent
$2,367/mo
Mortgage (P&I)
−$839
Tax + insurance
−$379
HOA
−$0
Vac / Maint / Mgmt
−$497
Net cashflow
$652/mo
Annual
$7,828/yr
Cap rate
11.19%
Cash-on-cash
17.48%
DSCR
1.78
1% rule
1.48%
Cash to close
$44,772
Investor read
- This is a 4-bed/2.0-bath single-family listed at $160k.
- At list price, monthly cash flow is $652 ($8k/yr) — positive.
- The deal already cash-flows at list — no discount required.
- Meets the 1% rule at list price ($2k rent vs $160k).
- Only 4 days on market — expect competitive offers; lowballing is unlikely to land.
- Local home prices are declining (-3.0%/yr); year-one equity from $1k of loan paydown is wiped out by about $5k of value loss. Plan a longer hold.
- Location reads 74/100 on livability (#285 in NY, #4,586 nationally) — a middle-class / working-renter tenant base. Strengths: housing A+, health & safety A+, crime A-; Watch: commute D+, amenities D.
- Mechanicville City School District (rural): math 57% / reading 57% proficiency, ranked #270 of 590 in NY (top 46%) — acceptable for families but not a draw, mixed tenant base, ~2y average lease.
- Zoned schools: Mechanicville Elementary School (math 57% / reading 53%, grade C, #905 of 2,108 statewide, top 43%, 600 students, 52% FRL); Mechanicville Junior/Senior High School (math 60% / reading 62%, grade C+, #843 of 1,100 statewide, top 77%, 746 students, 45% FRL) — zoned schools average 48% FRL vs 30% district-wide (18 pts higher); higher-poverty schools than district average — tighter screening recommended.
- Watch-outs: built in 1926 — expect roof / HVAC / electrical / plumbing capex.
- Market conditions: 48 active listings in the ZIP; solid renter incomes; 1,132 units permitted in Saratoga County in 2024 (378 in 5+ unit buildings).
- Saratoga County population projected at +4% by 2050 — modest demand growth; plan on rents tracking national, not racing it.
- 5 sale attempts since 22y ago with the ask held roughly flat each time — persistent listings suggest the price (not the market) is what's stuck; bring a comps-based counter.
- At projected returns (-3.0% appreciation + 3.0% rent growth), your $45k cash investment doubles in ~7 years — after that, you're playing with house money.
- This rent runs 31% of the median local income ($92k/yr) — at the standard rent-burdened threshold; future hikes will face affordability resistance.
Questions for listing agent
- Built in 1926 — when were the roof, HVAC, electrical panel, plumbing, and water heater last replaced?
- Is there a deadline driving the sale (1031 exchange, divorce, estate, relocation)? That informs how much negotiation room exists.
- What's the average days-on-market for RENTAL listings here right now (not sales)? A rising rental-DOM trend means longer vacancies and softer asking-rent achievability than the comps imply.
- What's the recent tenant-quality profile in this submarket — average credit score on applications, eviction rate, late-payment / NSF rate, and stable-employment percentage? A property-management company in the area should have these aggregated.
- How much new for-sale + rental construction is in the pipeline within 1–3 miles? Heavy new supply typically softens prices + rents 12–24 months out; constrained supply supports both.
CashFlowRE · CFR-5YNH8Y4N7VXE1M
· Data 4 weeks ago
cashflowre.app · 2026-05-29