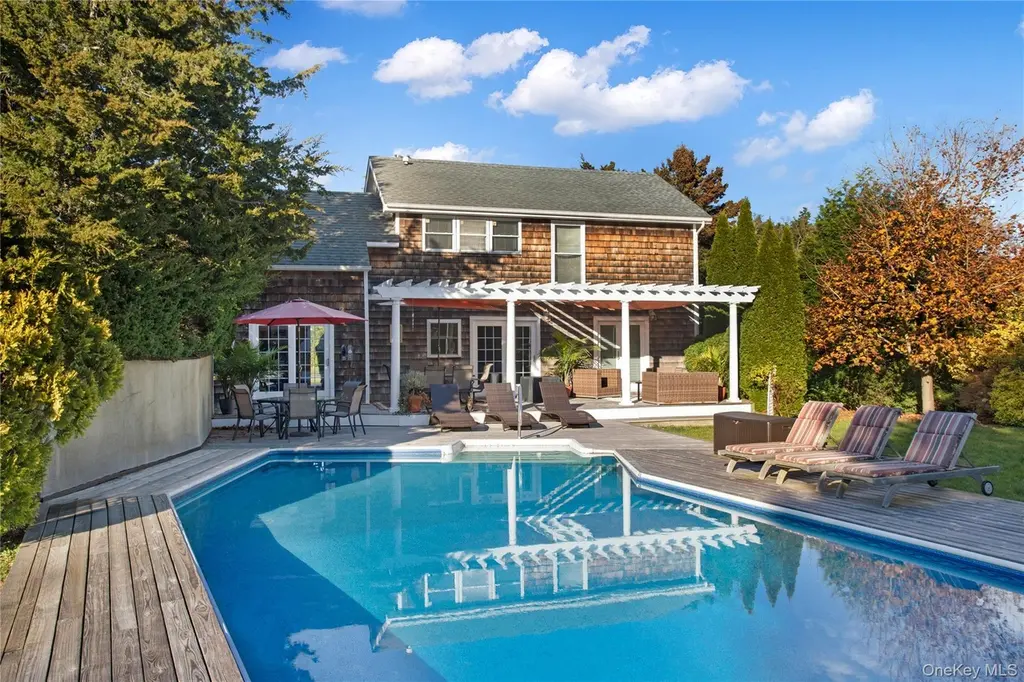
112 Upper 7 Ponds Rd
Water Mill, NY 11976
$2,495,000A-
4 bd · 3.0 ba ·
2,134 sqft ·
Built 1993
· SingleFamily
· Active
· 196 DOM
Cashflow @ list (25.0% down · 7.5%)
Estimated rent
$52,089/mo
Mortgage (P&I)
−$13,084
Tax + insurance
−$4,158
HOA
−$0
Vac / Maint / Mgmt
−$10,939
Net cashflow
$23,908/mo
Annual
$286,899/yr
Cap rate
17.79%
Cash-on-cash
41.07%
DSCR
2.83
1% rule
2.09%
Cash to close
$698,600
Investor read
- This is a 4-bed/3.0-bath single-family listed at $2.50M.
- At list price, monthly cash flow is $24k ($287k/yr) — positive.
- The deal already cash-flows at list — no discount required.
- Meets the 1% rule at list price ($52k rent vs $2.50M).
- It's been on market 196 days — a 12% lower offer ($2.20M) is reasonable based on typical stale-listing flexibility.
- Recommended offer: $2.20M (12.0% below list) — sets the bar for market timing.
- In year one you build about $233k of equity ($17k loan paydown + $215k appreciation (8.6% local appreciation)).
- Location reads 71/100 on livability (#410 in NY) — a middle-class / working-renter tenant base. Strengths: crime A+, employment A+, commute A-; Watch: amenities F, cost of living F, housing F.
- Southampton Union Free School District (suburban): math 53% / reading 51% proficiency, ranked #293 of 590 in NY (top 50%) — acceptable for families but not a draw, mixed tenant base, ~2y average lease.
- Market conditions: Rents rising fast (+30.1%/yr); 52 active listings in the ZIP; 6 comparable units currently listed for rent nearby; rentals lingering (median 44d on market — plan ~5-8 weeks vacancy on turnover, expect pricing pressure); 83% of comp listings sitting > 30 days — soft ceiling on asking rent; high-income renter base; 1,366 units permitted in Suffolk County in 2024 (216 in 5+ unit buildings).
- Suffolk County population projected to shrink 5% by 2050 — rents likely to lag national; underwrite the cash flow, not the appreciation.
- At projected returns (8.6% appreciation + 8.0% rent growth), your $699k cash investment doubles in ~2 years — after that, you're playing with house money.
- By year 2, paydown + projected appreciation supports a ~$373k cash-out refi (75% LTV) — recoverable capital for the next deal without selling this one.
- Climate carrying-cost: severe wind risk, 80% chance of damaging wind over 30y — expect insurance premiums to compound above CPI over the hold.
- Cap rate 17.8% vs local median 10.6% in Water Mill — top-decile yield for the area; either an underpriced asset or a hidden risk that comps aren't pricing in. Stress-test before assuming the spread holds.
- At $52,089/mo this rent would consume 347% of the median local household income ($180k/yr) — very limited rent-growth headroom before tenants either downsize or default.
Questions for listing agent
- It's been on market 196 days. Have you received any prior offers? Is the seller open to a 12% concession, seller financing, or rate buy-down credit?
- Why hasn't it sold? Are there any deal-killer items the seller is aware of (foundation, flood, title, zoning, code violations)?
- Is there a deadline driving the sale (1031 exchange, divorce, estate, relocation)? That informs how much negotiation room exists.
- What's the average days-on-market for RENTAL listings here right now (not sales)? A rising rental-DOM trend means longer vacancies and softer asking-rent achievability than the comps imply.
- What's the recent tenant-quality profile in this submarket — average credit score on applications, eviction rate, late-payment / NSF rate, and stable-employment percentage? A property-management company in the area should have these aggregated.
- How much new for-sale + rental construction is in the pipeline within 1–3 miles? Heavy new supply typically softens prices + rents 12–24 months out; constrained supply supports both.
CashFlowRE · CFR-5Z3Q416DN8A3TH
· Data 2 days ago
cashflowre.app · 2026-05-29