2865 S 1 Ave Unit 2867 S 1 AVE
Yuma, AZ 85364
$580,000F
2 bd · 1.0 ba ·
— sqft ·
Built —
· Condo
· Pending
· 9 DOM
Cashflow @ list (25.0% down · 7.5%)
Estimated rent
$1,277/mo
Mortgage (P&I)
−$3,042
Tax + insurance
−$967
HOA
−$0
Vac / Maint / Mgmt
−$268
Net cashflow
$-2,999/mo
Annual
$-35,990/yr
Cap rate
0.09%
Cash-on-cash
-22.16%
DSCR
0.01
1% rule
0.22%
Cash to close
$162,400
Investor read
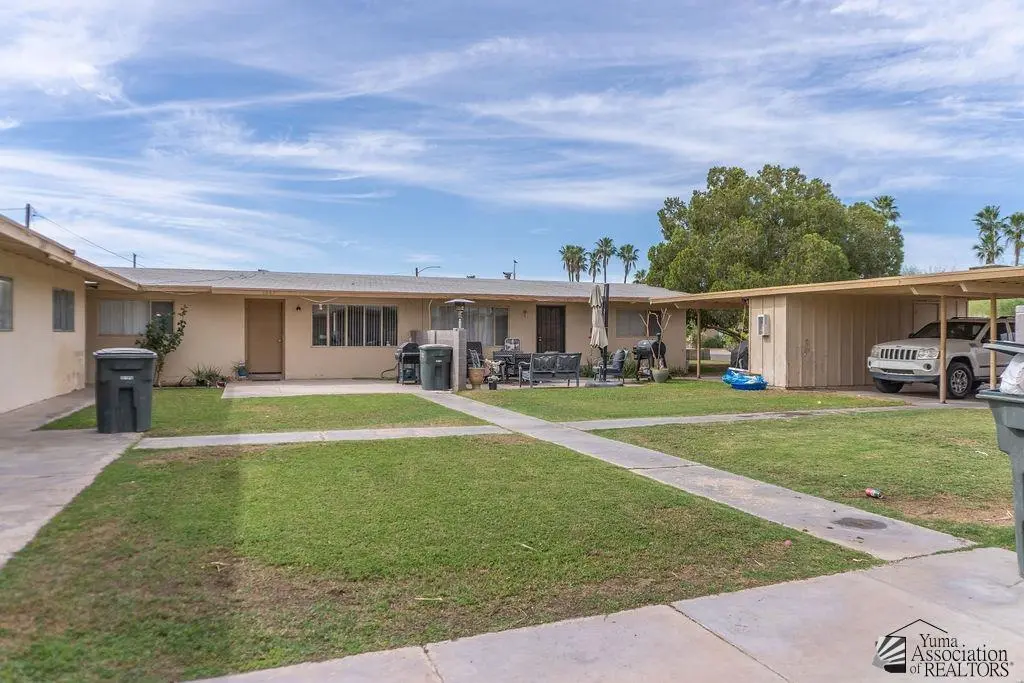
- This is a 2-bed/1.0-bath condo listed at $580k. Condition is rated fair.
- At list price, monthly cash flow is $-3k ($-36k/yr) — negative.
- To cash-flow at today's rent, offer at most $146k (74.8% below list).
- To meet the 1% rule (rent ≥ 1% of price), the offer needs to be $128k (78.0% below list).
- Only 9 days on market — expect competitive offers; lowballing is unlikely to land.
- Recommended offer: $128k (78.0% below list) — sets the bar for 1% rule.
- Local home prices are declining (-3.0%/yr); year-one equity from $4k of loan paydown is wiped out by about $17k of value loss. Plan a longer hold.
- Location reads 71/100 on livability (#30 in AZ) — a middle-class / working-renter tenant base. Strengths: cost of living A+, housing A+, health & safety A+; Watch: schools C-, crime C-, employment D.
- Yuma Union High School District (4507) (urban): math 14% / reading 16% proficiency, ranked #212 of 249 in AZ (top 85%) — low school quality limits family demand, transient renter base, plan for 1-2y turnover.
- Market conditions: Rents rising (+2.0%/yr); 262 active listings in the ZIP; 39 comparable units currently listed for rent nearby; rentals leasing fast (median 14d on market — plan ~1-2 weeks tenant-placement turnaround); 1,399 units permitted in Yuma County in 2024 (180 in 5+ unit buildings).
- Yuma County population projected at +4% by 2050 — modest demand growth; plan on rents tracking national, not racing it.
- Climate carrying-cost: extreme-heat days projected 7→20/yr by 2055 (HVAC capex compounding) — expect insurance premiums to compound above CPI over the hold.
- Cap rate 0.1% vs local median 3.9% in Yuma — below-typical yield; the buyer is paying a premium for something (appreciation thesis, condition, location) that the cap rate doesn't capture.
Questions for listing agent
- What do current leases actually rent for vs. the listed asking? Can we see a recent rent roll and the last 12 months of T-12 income?
- Have any recent inspections been done? Can we get a copy of the seller's disclosures and any deferred-maintenance estimates?
- Any open or pending special assessments — roof, HVAC, plumbing, elevator, façade? What's the per-unit balance and payoff schedule, and is the seller paying it off at close or rolling it to the buyer?
- Is there a deadline driving the sale (1031 exchange, divorce, estate, relocation)? That informs how much negotiation room exists.
- The area grade is low — what's the realistic commute time and amenity access for the typical tenant pool here? Any planned neighborhood developments (good or bad) we should know about?
- What's the average days-on-market for RENTAL listings here right now (not sales)? A rising rental-DOM trend means longer vacancies and softer asking-rent achievability than the comps imply.
- What's the recent tenant-quality profile in this submarket — average credit score on applications, eviction rate, late-payment / NSF rate, and stable-employment percentage? A property-management company in the area should have these aggregated.
- How much new apartment / multifamily construction is in the pipeline within 1–3 miles? Heavy new supply (>2% of stock underway) typically softens rents 12–24 months out; light construction supports rent growth.
Repairs flagged (vision-AI assessment)
- Minor: kitchen cabinets — dated and cluttered
- Minor: bathroom fixtures — standard and cluttered
- Moderate: exterior paint — moderate wear and discoloration
CashFlowRE · CFR-5Z62WR2MF4J0C6
· Data 6 days ago
cashflowre.app · 2026-05-29