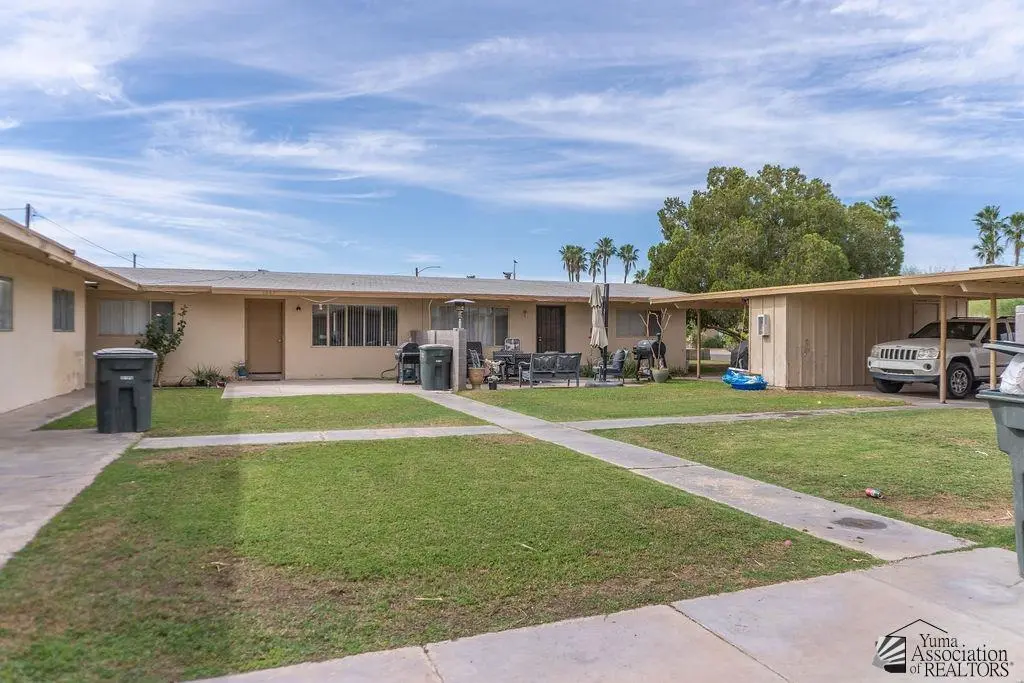
2865 S 1 Ave Unit 2867 S 1 AVE · Yuma, AZ
Flood risk 1/10 · Minimal
- FEMA flood zone
- X (shaded)
- Chance of flooding over 30 yrs
- 0.0%
- Est. flood insurance / yr
- $507 – $1,088
Fire risk 2/10 · Minimal
- Est. fire insurance / yr
- $610 – $1,132
Heat risk 9/10 · Severe
- Hot days now (above 113°F)
- 7 days/yr
- Hot days in 30 yrs
- 20 days/yr
Wind risk 1/10 · Minimal
- Chance of severe wind over 30 yrs
- —
Air-quality risk 2/10 · Minimal
- Unhealthy air days now
- 2 days/yr
- Unhealthy air days in 30 yrs
- 2 days/yr
Risk factors via First Street. Map © Google.
Why this score? — see what drove the F grade
The composite is a weighted blend of 9 inputs, each scored 0–100. Each bar is that input's sub-score; the figure is the points it added to the 100-point composite (weight × sub-score).
- ARV discount +7.5/15.0
- Livability +3.6/5.0
- Rent growth +3.0/5.0
- Condition / age +2.2/5.0
- Schools +1.3/10.0
- Cash flow +0.0/30.0
- 1% rule +0.0/10.0
- DSCR +0.0/10.0
- Appreciation +0.0/10.0
$580,000
🖨 Deal sheet 📄 Offer letter ✓ Due diligence
Listing remarks
A rare find - 6 plex close to shopping and restaurants.
Key facts
- Close to restaurants
- Close to shopping
- Listed 9 days
Tags
Property features AI
Exterior
- Parking: Carport; Open parking; On-street parking
- Utilities: Electric service on property
- Home design: Residential income property; Multi-family (2–8 plex options)
- Exterior features: Open parking; On-street parking; Carport
Interior
- Kitchen: Dishwasher; Range
- Heating & cooling: Central heating; Central cooling
- Interior features: Dishwasher; Range; Central heating; Central cooling
Neighborhood map
What this means for you Summary
Snapshot
- This is a 2-bed/1.0-bath condo listed at $580k. Condition is rated fair.
Deal economics
- At list price, monthly cash flow is $-3k ($-36k/yr) — negative.
- To cash-flow at today's rent, offer at most $146k (74.8% below list).
- To meet the 1% rule (rent ≥ 1% of price), the offer needs to be $128k (78.0% below list).
- Recommended offer: $128k (78.0% below list) — sets the bar for 1% rule.
- Cap rate 0.1% vs local median 3.9% in Yuma — below-typical yield; the buyer is paying a premium for something (appreciation thesis, condition, location) that the cap rate doesn't capture.
Location & tenants
- Location reads 71/100 on livability (#30 in AZ) — a middle-class / working-renter tenant base. Strengths: cost of living A+, housing A+, health & safety A+; Watch: schools C-, crime C-, employment D.
- Yuma Union High School District (4507) (urban): math 14% / reading 16% proficiency, ranked #212 of 249 in AZ (top 85%) — low school quality limits family demand, transient renter base, plan for 1-2y turnover.
- Market conditions: Rents rising (+2.0%/yr); 262 active listings in the ZIP; 39 comparable units currently listed for rent nearby; rentals leasing fast (median 13d on market — plan ~1-2 weeks tenant-placement turnaround); 1,399 units permitted in Yuma County in 2024 (180 in 5+ unit buildings).
Forward outlook
- Local home prices are declining (-3.0%/yr); year-one equity from $4k of loan paydown is wiped out by about $17k of value loss. Plan a longer hold.
- Yuma County population projected at +4% by 2050 — modest demand growth; plan on rents tracking national, not racing it.
Negotiation context
- Only 9 days on market — expect competitive offers; lowballing is unlikely to land.
Risks & watch-outs
- Climate carrying-cost: extreme-heat days projected 7→20/yr by 2055 (HVAC capex compounding) — expect insurance premiums to compound above CPI over the hold.
Questions for the listing agent
- What do current leases actually rent for vs. the listed asking? Can we see a recent rent roll and the last 12 months of T-12 income?
- Have any recent inspections been done? Can we get a copy of the seller's disclosures and any deferred-maintenance estimates?
- Any open or pending special assessments — roof, HVAC, plumbing, elevator, façade? What's the per-unit balance and payoff schedule, and is the seller paying it off at close or rolling it to the buyer?
- Is there a deadline driving the sale (1031 exchange, divorce, estate, relocation)? That informs how much negotiation room exists.
- The area grade is low — what's the realistic commute time and amenity access for the typical tenant pool here? Any planned neighborhood developments (good or bad) we should know about?
- What's the average days-on-market for RENTAL listings here right now (not sales)? A rising rental-DOM trend means longer vacancies and softer asking-rent achievability than the comps imply.
- What's the recent tenant-quality profile in this submarket — average credit score on applications, eviction rate, late-payment / NSF rate, and stable-employment percentage? A property-management company in the area should have these aggregated.
- How much new apartment / multifamily construction is in the pipeline within 1–3 miles? Heavy new supply (>2% of stock underway) typically softens rents 12–24 months out; light construction supports rent growth.
Investment metrics
- 1% rule
- 0.22% ✗
- Cap rate
- 0.09%
- Cash-on-cash
- -22.16%
- DSCR
- 0.01
- GRM
- 37.8
CMA / ARV
No comps found within radius.
Projected returns pro-forma
-3.0% appreciation · 2.04% rent growth · sell at horizon
- IRR
- -64.6%
- Equity multiple
- -0.76×
- Total profit
- $-286,207
- Equity at exit
- $86,480
- IRR
- —
- Equity multiple
- -2.08×
- Total profit
- $-500,032
- Equity at exit
- $50,148
Cash invested: $162,400 (down + closing). Projections, not guarantees.
Landlord ↔ Tenant lean methodology
- Overall (STATE)
- 87 Strongly Landlord-Friendly
- State Arizona
- 87 Strongly Landlord-Friendly · R+3
- County
- — inherits STATE
- City
- — inherits STATE
ZIP-level market 85364
- Rents YoY
- 2.0%
- Active inventory
- 262
- Price-to-rent
- 37.8×
Monthly cashflow live
- Estimated rent
- $1,277 high interval (Pro) →
- Mortgage (P&I)
- −$3,042
- Tax est. 1.5%
- −$725 /mo · $8,700/yr
- Insurance
- −$242
- HOA
- −$0
- Vacancy / Maint / Mgmt
- −$268
- Net cashflow
- $-2,999
Break-even live
UW: 25.0% down · 7.5% · 30yr · 1.5% tax · 5.0% vac · 8.0% maint · 8.0% mgmt
Financing live
Cash to close
- Down payment
- $145,000
- Closing costs
- $17,400
- Reserves months
- —
- Total cash needed
- —
Loan-product check · same deal, 3 products live
Conventional
25% down · 7.5% · 30yr
- Down + closing
- —
- Monthly P&I
- —
- Monthly cashflow
- —
- DSCR
- —
- Eligible?
- —
Personal DTI + credit; lowest rate.
DSCR
20% down · 8.5% · 30yr
- Down + closing
- —
- Monthly P&I
- —
- Monthly cashflow
- —
- DSCR
- —
- Eligible?
- —
No personal income docs; deal must DSCR.
Hard money
10% down · 12.0% · 12mo
- Down + closing
- —
- Monthly P&I
- —
- Monthly cashflow
- —
- DSCR
- —
- Eligible?
- —
Short-term bridge; refi at stabilization.
Rent comps 39 comps
| Address | Beds | Baths | Sqft | Rent | $/sqft | DOM | Units | Dist |
|---|---|---|---|---|---|---|---|---|
| 225 W Catalina Dr Yuma, AZ | 1.0–2.0 | 1.0–2.0 | 777 | $1,363 | $1.75 | 13d | 7 | 0.16mi |
| 143 W 27th Pl Yuma, AZ | 3.0 | 2.0 | 1277 | $1,500 | $1.17 | 21d | 1 | 0.19mi |
| 2714 S Virginia Dr Yuma, AZ | 2.0 | 1.0 | 750 | $925 | $1.23 | 13d | 2 | 0.23mi |
| 2621 S Virginia Dr Unit 206 Yuma, AZ | 1.0 | 1.0 | 580 | $850 | $1.47 | 21d | 1 | 0.33mi |
| 515 E Country Club Dr Unit 515B Yuma, AZ | 2.0 | 1.0 | 800 | $1,200 | $1.50 | 13d | 1 | 0.50mi |
| 517 E Country Club Dr Unit 517D Yuma, AZ | 2.0 | 1.0 | 800 | $1,200 | $1.50 | 13d | 1 | 0.52mi |
| 701 E 24th St Yuma, AZ | 1.0 | 1.0 | 608 | $1,000 | $1.64 | 13d | 1 | 0.68mi |
| 2950 S Mary Ave Yuma, AZ | 2.0 | 1.0 | — | $1,100 | — | 13d | 1 | 0.81mi |
| 2173 S 1st Ave Unit 10 Yuma, AZ | 1.0 | 1.0 | 550 | $850 | $1.55 | 21d | 1 | 0.91mi |
| 2183 S Walnut Ave Unit 2 Yuma, AZ | 2.0 | 1.0 | 672 | $975 | $1.45 | 13d | 1 | 0.93mi |
| 3601 S 4th Ave Yuma, AZ | 1.0 | 1.0 | 400 | $925 | $2.31 | 13d | 1 | 0.94mi |
| 1169 W 34th St Yuma, AZ | 3.0 | 1.5 | 1430 | $1,750 | $1.22 | 13d | 1 | 0.97mi |
| 2122 S Maple Ave Unit C Yuma, AZ | 2.0 | 1.0 | — | $1,100 | — | 13d | 1 | 0.98mi |
| 3533 S Cholla Dr Yuma, AZ | 2.0 | 2.0 | 1814 | $2,495 | $1.38 | 21d | 1 | 0.98mi |
| 3539 S Cholla Dr Yuma, AZ | 3.0 | 2.0 | 1973 | $2,150 | $1.09 | 13d | 1 | 0.99mi |
| 1280 W 24th St Unit 02 Yuma, AZ | 2.0 | 2.0 | 750 | $1,250 | $1.67 | 21d | 1 | 1.03mi |
| 1280 W 24th St Unit 32 Yuma, AZ | 2.0 | 1.0 | 700 | $1,200 | $1.71 | 21d | 1 | 1.05mi |
| 1280 W 24th St Apt 23 Yuma, AZ | 2.0 | 1.0 | 700 | $1,200 | $1.71 | 13d | 1 | 1.05mi |
| 1280 W 24th St Unit 37 Yuma, AZ | 1.0 | 1.0 | 650 | $900 | $1.38 | 21d | 1 | 1.05mi |
| 2045 S Walnut Ave Yuma, AZ | 3.0 | 1.0 | 940 | $1,480 | $1.57 | 21d | 1 | 1.09mi |
| 1778 W 28th St Yuma, AZ | 3.0 | 2.0 | 1200 | $3,300 | $2.75 | 13d | 1 | 1.12mi |
| 3749 S 4th Ave Unit 224 Yuma, AZ | 2.0 | 2.0 | 960 | $1,400 | $1.46 | 21d | 1 | 1.12mi |
| 2533 S Olivia Ave Yuma, AZ | 3.0 | 2.0 | 1287 | $1,495 | $1.16 | 13d | 1 | 1.13mi |
| 600 W 20th Pl Yuma, AZ | 3.0 | 2.0 | 1521 | $1,400 | $0.92 | 13d | 1 | 1.13mi |
| 2150 S Avenue A #26 Yuma, AZ | 2.0 | 2.0 | 905 | $1,550 | $1.71 | 13d | 1 | 1.17mi |
| 2150 S Avenue A #60 Yuma, AZ | 2.0 | 2.0 | 905 | $1,050 | $1.16 | 13d | 1 | 1.17mi |
| 1947 S Maple Ave Yuma, AZ | 1.0 | 1.0 | — | $480 | — | 13d | 2 | 1.19mi |
| 2044 S 11th Ave Unit 1 Yuma, AZ | 1.0 | 1.0 | 650 | $900 | $1.38 | 13d | 1 | 1.21mi |
| 1900 W 30th St Yuma, AZ | 2.0–3.0 | 2.0 | 1024 | $804 | $0.79 | 13d | 1 | 1.24mi |
| 2100 S Avenue A Yuma, AZ | 1.0 | 1.0 | 594 | $1,010 | $1.70 | 13d | 1 | 1.25mi |
| 2231 S Elks Ln #84 Yuma, AZ | 3.0 | 1.5 | 1804 | $2,200 | $1.22 | 13d | 1 | 1.26mi |
| 2369 S Camino Tierra Yuma, AZ | 3.0 | 2.0 | 1479 | $2,300 | $1.56 | 13d | 1 | 1.26mi |
| 2240 S Elks Ln #37 Yuma, AZ | 2.0 | 1.5 | 1212 | $1,950 | $1.61 | 13d | 1 | 1.27mi |
| 1103 W 20th St Unit 1005 Yuma, AZ | 2.0 | 1.0 | 742 | $1,000 | $1.35 | 13d | 1 | 1.29mi |
| 1103 W 20th St Unit 1045 Yuma, AZ | 1.0 | 1.0 | 633 | $1,000 | $1.58 | 13d | 1 | 1.29mi |
| 2155 S 14th Ave #16 Yuma, AZ | 2.0 | 2.0 | 1200 | $1,300 | $1.08 | 13d | 1 | 1.33mi |
| 1955 South Avenue A Unit A Yuma, AZ | 3.0 | 1.5 | 1308 | $1,400 | $1.07 | 21d | 1 | 1.37mi |
| 1910 S Avenue A Yuma, AZ | 2.0 | 1.0 | 543 | $970 | $1.79 | 13d | 5 | 1.39mi |
| 326 W 17th Pl Unit 5 Yuma, AZ | 1.0 | 1.0 | — | $795 | — | 13d | 1 | 1.42mi |
HOA detail condo
- Monthly dues
- $0 · $0/yr
- Assessments
- None detected in remarks — confirm with the listing agent.
Listing history 2 events
-
2026-04-30status Pending
-
2026-04-21$580,000 Active
ⓘ Source: listings_history table (triggers on properties + properties_extension) + one-shot
backfill from property_details.listing_events for pre-trigger history.
Climate risk First Street
- Flood 1/10 Low FEMA zone X (shaded) · 0% chance over 30 yrs
- Wildfire 2/10 Low
- Heat 9/10 Extreme 7 d/yr ≥113°F today · 20 d/yr by 30 yrs out
- Wind 1/10 Low
- Air quality 2/10 Low 2 unhealthy d/yr today · 2 by 30 yrs out
Nearby sold comps map
Loading sold comps map…
Walkable amenities ~0.75 mi
Loading nearby amenities…
Taxation est. · year 1
- Rental income
- $15,328
- − Mortgage interest
- −$32,489
- − Property taxes
- −$8,700
- − Insurance
- −$2,900
- − Repairs & maintenance
- −$1,226
- − Management
- −$1,226
- − Depreciation
- −$16,873
- Taxable loss
- −$48,086
- Est. tax savings @ 24.0%
- +$11,541
- After-tax cash flow
- $-24,449/yr
For passive investors: Depreciation is non-cash, so a rental often shows a tax loss while cash-flowing — sheltering income. Rental losses are passive: they offset passive income freely, and up to $25,000/yr can offset ordinary (W-2) income if you actively participate and your MAGI is under $100k (phasing out to $0 by $150k); unused losses carry forward. On sale, claimed depreciation is recaptured at up to 25%, and gains may owe capital-gains tax (a 1031 exchange can defer both). Figures are a year-1 estimate at your 24.0% rate — not tax advice; consult a CPA.
Condition & rehab AI · 13 photos
This multi-family property requires moderate repairs and maintenance to improve its condition and value. Painting the exterior and updating the kitchen and bathrooms would significantly enhance its appeal and marketability.
Repairs flagged
- Minor kitchen cabinets — dated and cluttered
- Minor bathroom fixtures — standard and cluttered
- Moderate exterior paint — moderate wear and discoloration
Value-add opportunities
- Both paint exterior — enhances curb appeal and resale value
- Both update kitchen and bathrooms — modernizes spaces and improves functionality
Renovation cost estimate screening
| Repair item | Severity | Est. cost |
|---|---|---|
| kitchen cabinets · dated and cluttered | Minor | $500–3,000 |
| bathroom fixtures · standard and cluttered | Minor | $500–3,000 |
| exterior paint · moderate wear and discoloration | Moderate | $3,000–15,000 |
| Total estimated repair cost · 3 items | $4,000–21,000 |
Value-add ROI direction
- Both paint exterior — enhances curb appeal and resale value ↑
- Both update kitchen and bathrooms — modernizes spaces and improves functionality ↑
ⓘ Cost ranges are severity-bucket heuristics (US national rule-of-thumb). Get contractor quotes + a written scope before underwriting a rehab budget.
Schools (NCES district)
- District
- Yuma Union High School District (4507)
- NCES district ID
- 0409630
- Math proficiency
- 14% ▼ -12.00%
- Reading proficiency
- 16% ▼ -10.00%
- Median HH income
- $40,512
- Composite
- 12.86/100
- National rank
- #9592
- State rank
- #212 of 249 in AZ
Livability — Yuma
- Score
- 71/100
- State rank
- #30
- US rank
- #6635
Category grades
Schools grade is shown separately in the Schools card above.
Census & demographics
- Census place
- Yuma, AZ
- County
- Yuma County · 149,809 people
- City population
- 149,809
- Metro
- Yuma, AZ
- Population (ZIP)
- 72,960
- Household income
- $57,874
- Rent vs Own
- Severe rent burden
- 2195.0
Population outlook (Yuma County) Hauer SSP2
- Today (2025)
- 211,633 people
- By 2030
- 214,114 · +1.2%
- By 2040
- 217,856 · +2.9%
- By 2050
- 220,276 · +4.1%
- By 2075
- 222,359 · +5.1%
- By 2100
- 198,880 · -6.0%
Race, ethnicity, and origin ACS 2023
- Neighborhood character
- Predominantly Hispanic (70%)
- Race & ethnicity
- Hispanic / Latino 70% Two or more races 29% White 24% Asian 2% Black 2% Native American 1%
- Hispanic origin (detail)
- Mexican 67%
- Common ancestry
- Portuguese 1% Lithuanian 1% Romanian 1%
- Foreign-born
- 22% · Canada
- Languages at home
- 48% English-only · Spanish 50% Tagalog/Filipino 1%
Political lean MEDSL · Yuma
- 2024 margin
- Strong R (+20.4) · D 39.3% · R 59.8%
- 2008→2024 swing
- -6.6pp toward R · 2008: -13.8pp · 2024: -20.4pp
- All cycles
- 2024: R+20.4 2020: R+6.2 2016: R+5.5 2012: R+16.1 2008: R+13.8
Not yet ingested
- Civics
- —
Market trends
- HPI YoY
- ▼ -197.00%
- Current HPI
- 220.8058
- Rent YoY
- ▲ 2.04%
- Metro
- Yuma, AZ
- State GDP YoY
- ▲ 4.54%
- F500 in state
- 20
Industry mix (Fortune 500 HQ in AZ)
| Industry | F500 HQs | Revenue |
|---|---|---|
| Technology | 2 | $13B |
|
||
| Mining / Metals | 1 | $23B |
|
||
| Environmental Services | 1 | $16B |
|
||
| Metals / Steel | 1 | $14B |
|
||
| Technology Distribution | 1 | $9B |
|
||
| Homebuilding | 1 | $8B |
|
||
Price history
2 events — show timeline
- 2026-04-30 Pending — YAR
- 2026-04-21 Listed $580,000 YAR
Cash-flow waterfall
monthlySold comps — $/sqft
last 12 mo · ≤1 miLoading sold comps…