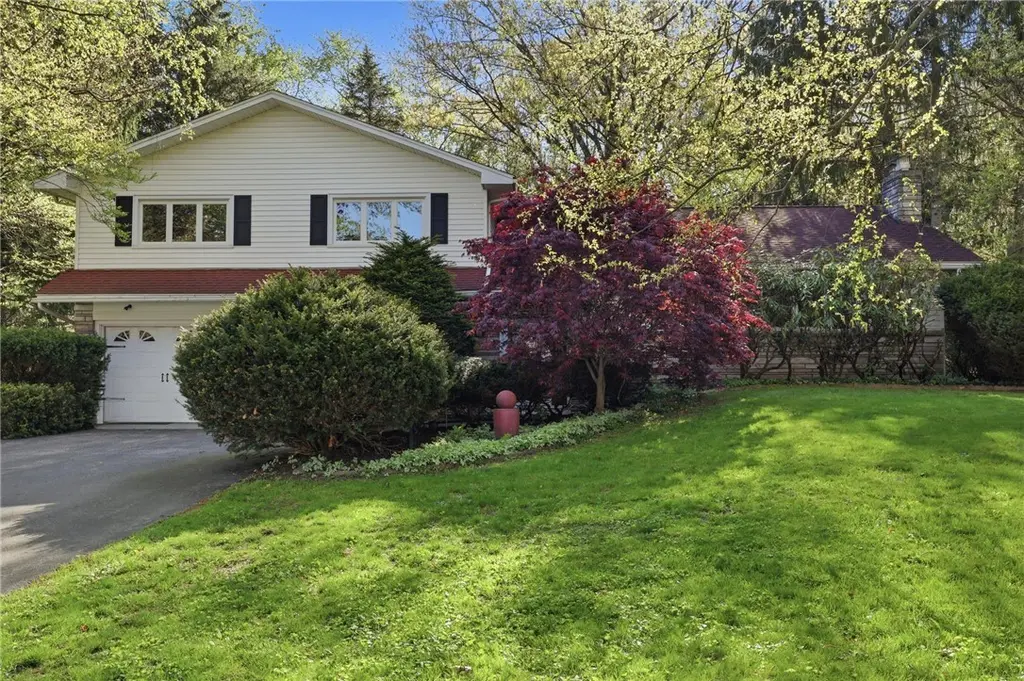
58 Landsdowne Ln
St. John Fisher College, NY 14618
$399,900D
4 bd · 2.5 ba ·
2,567 sqft ·
Built 1960
· SingleFamily
· Pending
· 25 DOM
Cashflow @ list (25.0% down · 7.5%)
Estimated rent
$3,723/mo
Mortgage (P&I)
−$2,097
Tax + insurance
−$1,065
HOA
−$0
Vac / Maint / Mgmt
−$782
Net cashflow
$-221/mo
Annual
$-2,647/yr
Cap rate
5.63%
Cash-on-cash
-2.36%
DSCR
0.89
1% rule
0.93%
Cash to close
$111,972
Investor read
- This is a 4-bed/2.5-bath single-family listed at $400k.
- At list price, monthly cash flow is $-221 ($-3k/yr) — negative.
- To cash-flow at today's rent, offer at most $361k (9.7% below list).
- To meet the 1% rule (rent ≥ 1% of price), the offer needs to be $372k (6.9% below list).
- It's been on market 25 days — a 2% lower offer ($394k) is reasonable based on typical stale-listing flexibility.
- Recommended offer: $361k (9.7% below list) — sets the bar for cash-flow.
- Local home prices are declining (-3.0%/yr); year-one equity from $3k of loan paydown is wiped out by about $12k of value loss. Plan a longer hold.
- Location reads: area grade D — affects rentability + tenant quality, not the cash-flow math above.
- East Rochester Union Free School District (suburban): math 50% / reading 51% proficiency, ranked #371 of 590 in NY (top 63%) — acceptable for families but not a draw, mixed tenant base, ~2y average lease.
- Zoned schools: East Rochester Elementary School (math 42% / reading 57%, grade D, #1,085 of 2,108 statewide, top 56%, 458 students, 48% FRL); East Rochester Junior-Senior High School (math 57% / reading 47%, grade D+, #946 of 1,100 statewide, top 88%, 515 students, 51% FRL).
- Watch-outs: property tax is 2.7% of price.
- Market conditions: 116 active listings in the ZIP; 2 comparable units currently listed for rent nearby; high-income renter base; 1,169 units permitted in Monroe County in 2024 (591 in 5+ unit buildings).
- Monroe County population projected to shrink 6% by 2050 — rents likely to lag national; underwrite the cash flow, not the appreciation.
- Cap rate 5.6% vs local median 16.6% in St. John Fisher College — below-typical yield; the buyer is paying a premium for something (appreciation thesis, condition, location) that the cap rate doesn't capture.
- This rent runs 36% of the median local income ($125k/yr) — at the standard rent-burdened threshold; future hikes will face affordability resistance.
Questions for listing agent
- What do current leases actually rent for vs. the listed asking? Can we see a recent rent roll and the last 12 months of T-12 income?
- Built in 1960 — when were the roof, HVAC, electrical panel, plumbing, and water heater last replaced?
- Property tax is high relative to price — has the assessment been appealed recently, and will the sale trigger a re-assessment?
- Is there a deadline driving the sale (1031 exchange, divorce, estate, relocation)? That informs how much negotiation room exists.
- The area grade is low — what's the realistic commute time and amenity access for the typical tenant pool here? Any planned neighborhood developments (good or bad) we should know about?
- What's the average days-on-market for RENTAL listings here right now (not sales)? A rising rental-DOM trend means longer vacancies and softer asking-rent achievability than the comps imply.
- What's the recent tenant-quality profile in this submarket — average credit score on applications, eviction rate, late-payment / NSF rate, and stable-employment percentage? A property-management company in the area should have these aggregated.
- How much new for-sale + rental construction is in the pipeline within 1–3 miles? Heavy new supply typically softens prices + rents 12–24 months out; constrained supply supports both.
CashFlowRE · CFR-5ZQRGKFGTPVC9V
· Data 1 week ago
cashflowre.app · 2026-05-29