58 Landsdowne Ln · St. John Fisher College, NY
Flood risk 1/10 · Minimal
- FEMA flood zone
- X (unshaded)
- Chance of flooding over 30 yrs
- 0.0%
- Est. flood insurance / yr
- $473 – $860
Fire risk 1/10 · Minimal
- Est. fire insurance / yr
- $691 – $1,283
Heat risk 2/10 · Minimal
- Hot days now (above 96°F)
- 7 days/yr
- Hot days in 30 yrs
- 16 days/yr
Wind risk 1/10 · Minimal
- Chance of severe wind over 30 yrs
- —
Air-quality risk 2/10 · Minimal
- Unhealthy air days now
- 1 days/yr
- Unhealthy air days in 30 yrs
- 2 days/yr
Risk factors via First Street. Map © Google.
Why this score? — see what drove the D grade
The composite is a weighted blend of 9 inputs, each scored 0–100. Each bar is that input's sub-score; the figure is the points it added to the 100-point composite (weight × sub-score).
- ARV discount +12.9/15.0
- Cash flow +10.3/30.0
- 1% rule +4.3/10.0
- Schools +4.3/10.0
- DSCR +2.9/10.0
- Rent growth +2.5/5.0
- Livability +2.5/5.0
- Condition / age +2.5/5.0
- Appreciation +0.0/10.0
$399,900
🖨 Deal sheet (PDF) 📄 Offer letter ✓ Due diligence
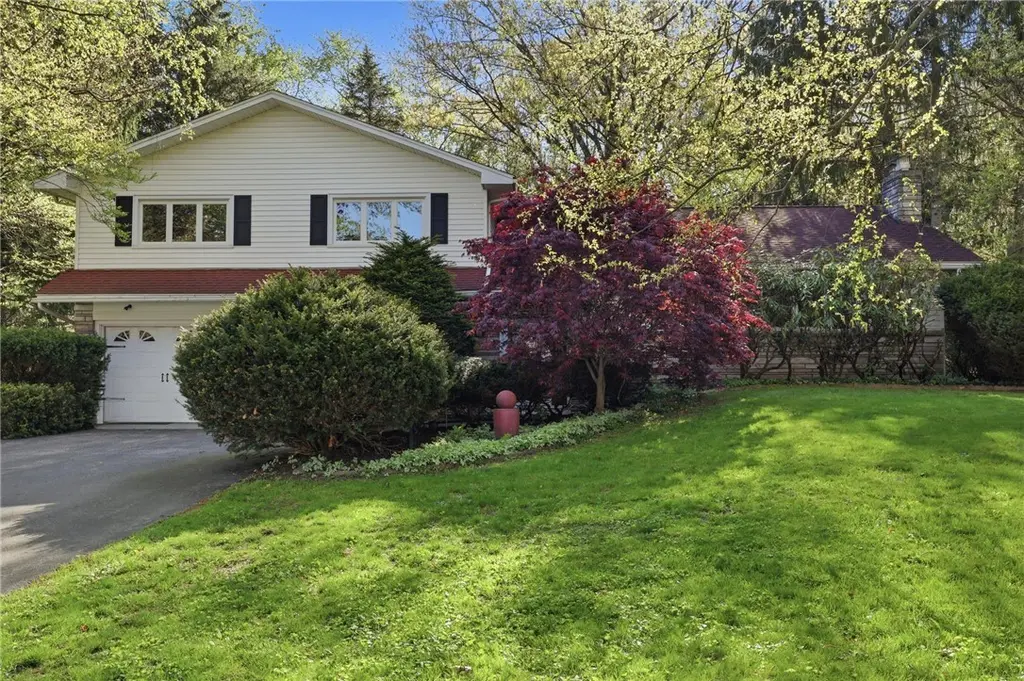
Listing remarks
Welcome to this move-in ready home offering nearly 2,600 sq. ft. in the highly desirable East Ave Manor neighborhood in Pittsford! Situated on a huge park-like . 67-acre lot, this spacious property features 4 bedrooms and 2.5 baths, including a massive primary suite with a private ensuite bath. Inside, you’ll find two separate oversized living areas, providing incredible flexibility for everyday living, entertaining, or multi-generational needs. The second living room was previously used as a bedroom/in-law setup, creating endless possibilities for the next owner. The kitchen features white cabinetry, Corian countertops, and a tile backsplash. The finished lower level adds even more l
Key facts
- Wet bar
- Private backyard
- Huge park like lot
Tags
Property features AI
Exterior
- Parking: Attached 2-car garage with garage door opener and electricity
- Utilities: Public water connected; Sewer connected; Cable available; High-speed internet available; Electric service with circuit breakers
- Home design: Two-story existing home; Below-grade finished area (partial finished basement)
- Construction: Stone and vinyl siding exterior; Asphalt roof; Block foundation; Copper plumbing; Built as an existing/resale property
- Exterior features: Awning(s); Blacktop driveway; Deck; Patio; Fully fenced yard; Irregular residential lot; City street frontage
Interior
- Kitchen: Dishwasher; Electric oven; Electric range; Refrigerator; Eat-in kitchen; Pantry
- Bedrooms: Total rooms include bedrooms as part of 9 total rooms
- Flooring: Hardwood floors; Tile floors; Varied flooring
- Bathrooms: Two full bathrooms; One half bathroom; One main-level bathroom
- Heating & cooling: Gas forced-air heating; Central air conditioning
- Interior features: Ceiling fans; Separate/formal dining room; Eat-in kitchen; Pantry; Primary bedroom with bath; Programmable thermostat; Thermal windows
- Laundry & utility: Washer; Dryer; Laundry on main level
Neighborhood map
What this means for you Summary
Snapshot
- This is a 4-bed/2.5-bath single-family listed at $400k.
Deal economics
- At list price, monthly cash flow is $-221 ($-3k/yr) — negative.
- To cash-flow at today's rent, offer at most $361k (9.7% below list).
- To meet the 1% rule (rent ≥ 1% of price), the offer needs to be $372k (6.9% below list).
- Recommended offer: $361k (9.7% below list) — sets the bar for cash-flow.
- Cap rate 5.6% vs local median 16.6% in St. John Fisher College — below-typical yield; the buyer is paying a premium for something (appreciation thesis, condition, location) that the cap rate doesn't capture.
Location & tenants
- Location reads: area grade D — affects rentability + tenant quality, not the cash-flow math above.
- East Rochester Union Free School District (suburban): math 50% / reading 51% proficiency, ranked #371 of 590 in NY (top 63%) — acceptable for families but not a draw, mixed tenant base, ~2y average lease.
- Zoned schools: East Rochester Elementary School (math 42% / reading 57%, grade D, #1,085 of 2,108 statewide, top 56%, 458 students, 48% FRL); East Rochester Junior-Senior High School (math 57% / reading 47%, grade D+, #946 of 1,100 statewide, top 88%, 515 students, 51% FRL).
- Market conditions: 116 active listings in the ZIP; 2 comparable units currently listed for rent nearby; high-income renter base; 1,169 units permitted in Monroe County in 2024 (591 in 5+ unit buildings).
- This rent runs 36% of the median local income ($125k/yr) — at the standard rent-burdened threshold; future hikes will face affordability resistance.
Forward outlook
- Local home prices are declining (-3.0%/yr); year-one equity from $3k of loan paydown is wiped out by about $12k of value loss. Plan a longer hold.
- Monroe County population projected to shrink 6% by 2050 — rents likely to lag national; underwrite the cash flow, not the appreciation.
Negotiation context
- It's been on market 25 days — a 2% lower offer ($394k) is reasonable based on typical stale-listing flexibility.
Risks & watch-outs
- Watch-outs: property tax is 2.7% of price.
Questions for the listing agent
- What do current leases actually rent for vs. the listed asking? Can we see a recent rent roll and the last 12 months of T-12 income?
- Built in 1960 — when were the roof, HVAC, electrical panel, plumbing, and water heater last replaced?
- Property tax is high relative to price — has the assessment been appealed recently, and will the sale trigger a re-assessment?
- Is there a deadline driving the sale (1031 exchange, divorce, estate, relocation)? That informs how much negotiation room exists.
- The area grade is low — what's the realistic commute time and amenity access for the typical tenant pool here? Any planned neighborhood developments (good or bad) we should know about?
- What's the average days-on-market for RENTAL listings here right now (not sales)? A rising rental-DOM trend means longer vacancies and softer asking-rent achievability than the comps imply.
- What's the recent tenant-quality profile in this submarket — average credit score on applications, eviction rate, late-payment / NSF rate, and stable-employment percentage? A property-management company in the area should have these aggregated.
- How much new for-sale + rental construction is in the pipeline within 1–3 miles? Heavy new supply typically softens prices + rents 12–24 months out; constrained supply supports both.
Investment metrics
- 1% rule
- 0.93% ✗
- Cap rate
- 5.63%
- Cash-on-cash
- -2.36%
- DSCR
- 0.89
- GRM
- 9.0
CMA / ARV
- ARV (median comp)
- $454,298
- List price
- $399,900
- Delta
- -11.97%
- Verdict
- UNDERPRICED
- Comps
- 20 within 1.0 mi
Show comp detail 12 sales within ~0.75 mi
| Address | Dist | Beds/Ba | Sqft | Sold | Price | $/sf | Match |
|---|---|---|---|---|---|---|---|
| 57 Landsdowne Ln | 0.04mi | 3/2.5 (-1) | 2,526 (-2%) | 7mo | $440,000 | $174 | 84 |
| 15 Trowbridge Trl | 0.18mi | 3/2.5 (-1) | 2,500 (-3%) | 4mo | $425,000 | $170 | 79 |
| 6 Shire Oaks Dr | 0.32mi | 3/2.0 (-1) | 2,387 (-7%) | 8mo | $650,000 | $272 | 60 |
| 40 Washington Rd | 0.38mi | 4/2.5 | 2,848 (+11%) | 10mo | $540,000 | $190 | 56 |
| 8 Cranswick Ln | 0.18mi | 5/2.5 (+1) | 2,928 (+14%) | 10mo | $508,000 | $173 | 55 |
| 32 Kimberly Rd | 0.55mi | 4/3.0 | 2,402 (-6%) | 8mo | $359,000 | $149 | 54 |
| 27 Shire Oaks Dr | 0.42mi | 4/1.5 | 2,331 (-9%) | 8mo | $500,000 | $215 | 54 |
| 4 Torwood Cir | 0.40mi | 5/2.5 (+1) | 2,324 (-10%) | 10mo | $355,000 | $153 | 52 |
| 51 Oak Manor Ln | 0.45mi | 4/2.0 | 2,202 (-14%) | 1mo | $502,000 | $228 | 52 |
| 23 Rippingale Rd | 0.68mi | 4/2.5 | 2,381 (-7%) | 5mo | $410,000 | $172 | 52 |
| 5 Glendower Cir | 0.75mi | 4/2.5 | 2,242 (-13%) | 1mo | $610,000 | $272 | 43 |
| 59 Callingham Rd | 0.72mi | 3/2.5 (-1) | 2,840 (+11%) | 3mo | $425,000 | $150 | 41 |
Match score weights: distance 35% · size 25% · config 20% · recency 20%. Top-matched comps best support the ARV.
Projected returns pro-forma
-3.0% appreciation · 3.0% rent growth · sell at horizon
- IRR
- -20.1%
- Equity multiple
- 0.30×
- Total profit
- $-78,549
- Equity at exit
- $59,626
- IRR
- -12.9%
- Equity multiple
- 0.24×
- Total profit
- $-85,267
- Equity at exit
- $34,576
Cash invested: $111,972 (down + closing). Projections, not guarantees.
Landlord ↔ Tenant lean methodology
- Overall (STATE)
- 15 Strongly Tenant-Friendly
- State New York
- 15 Strongly Tenant-Friendly · D+10
- County
- — inherits STATE
- City
- — inherits STATE
ZIP-level market 14618
- Active inventory
- 116
- Price-to-rent
- 9.0×
Monthly cashflow live
- Estimated rent
- $3,723 medium interval (Pro) →
- Mortgage (P&I)
- −$2,097
- Tax from tax record
- −$898 /mo · $10,775/yr
- Insurance
- −$167
- HOA
- −$0
- Vacancy / Maint / Mgmt
- −$782
- Net cashflow
- $-221
Break-even live
Sensitivity live
| Price | -10% $6 | -5% $-107 | +0% $-221 | +5% $-334 | +10% $-447 |
|---|---|---|---|---|---|
| Rent | -10% $-515 | -5% $-368 | +0% $-221 | +5% $-74 | +10% $74 |
| Rate | -1.0pp $-19 | -0.5pp $-119 | base $-221 | +0.5pp $-324 | +1.0pp $-430 |
UW: 25.0% down · 7.5% · 30yr · 1.5% tax · 5.0% vac · 8.0% maint · 8.0% mgmt
Financing live
Cash to close
- Down payment
- $99,975
- Closing costs
- $11,997
- Reserves months
- —
- Total cash needed
- —
Loan-product check · same deal, 3 products live
Conventional
25% down · 7.5% · 30yr
- Down + closing
- —
- Monthly P&I
- —
- Monthly cashflow
- —
- DSCR
- —
- Eligible?
- —
Personal DTI + credit; lowest rate.
DSCR
20% down · 8.5% · 30yr
- Down + closing
- —
- Monthly P&I
- —
- Monthly cashflow
- —
- DSCR
- —
- Eligible?
- —
No personal income docs; deal must DSCR.
Hard money
10% down · 12.0% · 12mo
- Down + closing
- —
- Monthly P&I
- —
- Monthly cashflow
- —
- DSCR
- —
- Eligible?
- —
Short-term bridge; refi at stabilization.
Rent comps 2 comps
| Address | Beds | Baths | Sqft | Rent | $/sqft | DOM | Units | Dist |
|---|---|---|---|---|---|---|---|---|
| 99 Brittany Ln Pittsford, NY | 2.0–3.0 | 2.0 | 1590 | $2,679 | $1.68 | 4d | 1 | 1.24mi |
| 74 S Main St Pittsford, NY | 4.0 | 2.0 | 1846 | $3,350 | $1.81 | 45d | 1 | 1.25mi |
Listing history 8 events
-
2026-06-09statusdays on market $399,900 Pending 25 DOM
-
2026-06-07days on market $399,900 Active 24 DOM
-
2026-06-05days on market $399,900 Active 21 DOM
-
2026-06-03days on market $399,900 Active 20 DOM
-
2026-06-03days on market $399,900 Active 19 DOM
-
2026-06-01days on market $399,900 Active 18 DOM
-
2026-05-31days on market $399,900 Active 17 DOM
-
2026-05-14$399,900 Active 1139-char remark
ⓘ Source: listings_history table (triggers on properties + properties_extension) + one-shot
backfill from property_details.listing_events for pre-trigger history.
Tax reassessment forecast NY · Partial reset (capped growth)
- Current annual tax
- $10,775 · $898/mo
- Projected year-2 tax
- $10,775 · $898/mo
- Expected delta
- $0/yr ($0/mo · 0.0%)
ⓘ Screening estimate from a state-policy table — verify with the county assessor before closing.
Climate risk First Street
- Flood 1/10 Low FEMA zone X (unshaded) · 0% chance over 30 yrs
- Wildfire 1/10 Low
- Heat 2/10 Low 7 d/yr ≥96°F today · 16 d/yr by 30 yrs out
- Wind 1/10 Low
- Air quality 2/10 Low 1 unhealthy d/yr today · 2 by 30 yrs out
Nearby sold comps map
Loading sold comps map…
Walkable amenities ~0.75 mi
Loading nearby amenities…
Taxation est. · year 1
- Rental income
- $44,675
- − Mortgage interest
- −$22,401
- − Property taxes
- −$10,775
- − Insurance
- −$2,000
- − Repairs & maintenance
- −$3,574
- − Management
- −$3,574
- − Depreciation
- −$11,633
- Taxable loss
- −$9,282
- Est. tax savings @ 24.0%
- +$2,228
- After-tax cash flow
- $-419/yr
For passive investors: Depreciation is non-cash, so a rental often shows a tax loss while cash-flowing — sheltering income. Rental losses are passive: they offset passive income freely, and up to $25,000/yr can offset ordinary (W-2) income if you actively participate and your MAGI is under $100k (phasing out to $0 by $150k); unused losses carry forward. On sale, claimed depreciation is recaptured at up to 25%, and gains may owe capital-gains tax (a 1031 exchange can defer both). Figures are a year-1 estimate at your 24.0% rate — not tax advice; consult a CPA.
Schools (NCES district)
- District
- East Rochester Union Free School District
- NCES district ID
- 3609930
- Math proficiency
- 50% ▼ -16.00%
- Reading proficiency
- 51% ▲ 5.00%
- Median HH income
- $50,308
- Composite
- 43.23/100
- National rank
- #3058
- State rank
- #371 of 590 in NY
Livability — St. John Fisher College
No livability data for this city. (Only ~50 U.S. cities are tracked.)
Census & demographics
- County
- Monroe County · 674,131 people
- Metro
- Rochester, NY
- Population (ZIP)
- 25,476
- Household income
- $125,098
- Rent vs Own
- Severe rent burden
- 548.0
Population outlook (Monroe County) Hauer SSP2
- Today (2025)
- 759,460 people
- By 2030
- 757,154 · -0.3%
- By 2040
- 740,644 · -2.5%
- By 2050
- 714,443 · -5.9%
- By 2075
- 645,883 · -15.0%
- By 2100
- 547,084 · -28.0%
Race, ethnicity, and origin ACS 2023
- Neighborhood character
- Predominantly White (80%)
- Race & ethnicity
- White 80% Asian 8% Two or more races 6% Black 4% Hispanic / Latino 3%
- Common ancestry
- Romanian 5% Scotch-Irish 3% Slovak 3%
- Foreign-born
- 10% · Canada, China, South Korea
- Languages at home
- 88% English-only · Other Asian/Pacific 2% Other Indo-European 2% Spanish 2%
Political lean MEDSL · Monroe
- 2024 margin
- D (+19.1) · D 59.5% · R 40.5%
- 2008→2024 swing
- +1.4pp toward D · 2008: 17.7pp · 2024: 19.1pp
- All cycles
- 2024: D+19.1 2020: D+21.0 2016: D+14.1 2012: D+17.4 2008: D+17.7
Not yet ingested
- Civics
- —
Market trends
- HPI YoY
- ▼ -246.83%
- Current HPI
- 271.6387
- Rent YoY
- —
- Metro
- Rochester, NY
- State GDP YoY
- ▲ 2.60%
- F500 in state
- 92
Industry mix (Fortune 500 HQ in NY)
| Industry | F500 HQs | Revenue |
|---|---|---|
| Financial Services | 10 | $950B |
|
||
| Consumer Goods | 9 | $162B |
|
||
| Insurance | 4 | $225B |
|
||
| Telecommunications | 2 | $144B |
|
||
| Pharmaceuticals | 2 | $112B |
|
||
| Media / Entertainment | 2 | $69B |
|
||
Price history
2 events — show timeline
- 2026-06-08 Pending — UNYREIS
- 2026-05-14 Listed $399,900 UNYREIS
Property tax history
+3.4%/yrLatest (2025): $10,775 · +25.6% YoY. Source: county tax records.
Cash-flow waterfall
monthlySold comps — $/sqft
last 12 mo · ≤1 miLoading sold comps…