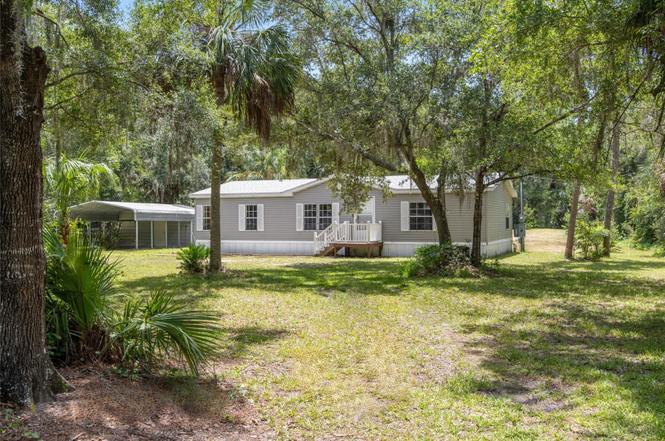
10220 W Pamondeho Cir
Crystal River, FL 34428
$204,900C-
3 bd · 2.0 ba ·
1,512 sqft ·
Built 2004
· Manufactured
· Active
· 193 DOM
Cashflow @ list (25.0% down · 7.5%)
Estimated rent
$2,098/mo
Mortgage (P&I)
−$1,075
Tax + insurance
−$633
HOA
−$12
Vac / Maint / Mgmt
−$441
Net cashflow
$-62/mo
Annual
$-740/yr
Cap rate
8.43%
Cash-on-cash
7.63%
DSCR
1.34
1% rule
1.02%
Cash to close
$57,372
Investor read
- This is a 3-bed/2.0-bath manufactured listed at $205k.
- At list price, monthly cash flow is $-62 ($-740/yr) — negative.
- To cash-flow at today's rent, offer at most $194k (5.3% below list).
- Meets the 1% rule at list price ($2k rent vs $205k).
- It's been on market 193 days — a 12% lower offer ($180k) is reasonable based on typical stale-listing flexibility.
- Recommended offer: $180k (12.0% below list) — sets the bar for market timing.
- Local home prices are declining (-3.0%/yr); year-one equity from $1k of loan paydown is wiped out by about $6k of value loss. Plan a longer hold.
- Location reads 66/100 on livability (#603 in FL) — a middle-class / working-renter tenant base. Strengths: crime A+, cost of living A+; Watch: health & safety C-, schools D+, amenities F.
- Citrus (rural): math 49% / reading 50% proficiency, ranked #44 of 73 in FL (top 60%) — families likely to look elsewhere, expect single-tenant / working-renter base with shorter leases.
- Watch-outs: flood insurance adds $427/mo.
- Market conditions: 320 active listings in the ZIP; 2,443 units permitted in Citrus County in 2024 (0 in 5+ unit buildings).
- Citrus County population projected to shrink 10% by 2050 — rents likely to lag national; underwrite the cash flow, not the appreciation.
- 5 sale attempts since 22y ago with the ask held roughly flat each time — persistent listings suggest the price (not the market) is what's stuck; bring a comps-based counter.
- Climate carrying-cost: in FEMA flood zone AE (mandatory federal flood insurance); severe wind risk, 99% chance of damaging wind over 30y; major wildfire risk; extreme-heat days projected 7→25/yr by 2055 (HVAC capex compounding) — expect insurance premiums to compound above CPI over the hold.
- Cap rate 8.4% vs local median 2.1% in Crystal River — top-decile yield for the area; either an underpriced asset or a hidden risk that comps aren't pricing in. Stress-test before assuming the spread holds.
- At $2,098/mo this rent would consume 50% of the median local household income ($51k/yr) (locally 264% of renters already pay >50% of income on rent) — very limited rent-growth headroom before tenants either downsize or default.
Questions for listing agent
- What do current leases actually rent for vs. the listed asking? Can we see a recent rent roll and the last 12 months of T-12 income?
- It's been on market 193 days. Have you received any prior offers? Is the seller open to a 12% concession, seller financing, or rate buy-down credit?
- What's the actual annual flood-insurance premium (NFIP or private), and is the property in a SFHA with mandatory coverage?
- What does the HOA fee cover, when was the last increase, and are there any pending special assessments or reserve-fund shortfalls?
- Why hasn't it sold? Are there any deal-killer items the seller is aware of (foundation, flood, title, zoning, code violations)?
- Is there a deadline driving the sale (1031 exchange, divorce, estate, relocation)? That informs how much negotiation room exists.
- Schools are D-rated, which usually means shorter tenancies and higher turnover. Who's the typical renter profile here, and what's been the actual vacancy rate?
- What's the average days-on-market for RENTAL listings here right now (not sales)? A rising rental-DOM trend means longer vacancies and softer asking-rent achievability than the comps imply.
CashFlowRE · CFR-5ZVZQJ2P77F7SV
· Data 1 day ago
cashflowre.app · 2026-05-29