10220 W Pamondeho Cir · Crystal River, FL
Flood risk 9/10 · Severe
- FEMA flood zone
- AE
- Chance of flooding over 30 yrs
- 0.99%
- Est. flood insurance / yr
- $1,737 – $8,500
Fire risk 7/10 · Major
- Est. fire insurance / yr
- $947 – $1,759
Heat risk 9/10 · Severe
- Hot days now (above 109°F)
- 7 days/yr
- Hot days in 30 yrs
- 25 days/yr
Wind risk 9/10 · Severe
- Chance of severe wind over 30 yrs
- 99.0%
Air-quality risk 1/10 · Minimal
- Unhealthy air days now
- 0 days/yr
- Unhealthy air days in 30 yrs
- 0 days/yr
Risk factors via First Street. Map © Google.
Why this score? — see what drove the C- grade
The composite is a weighted blend of 9 inputs, each scored 0–100. Each bar is that input's sub-score; the figure is the points it added to the 100-point composite (weight × sub-score).
- Cash flow +23.0/30.0
- DSCR +7.4/10.0
- 1% rule +5.2/10.0
- Schools +4.1/10.0
- Livability +3.3/5.0
- ARV discount +2.5/15.0
- Rent growth +2.5/5.0
- Condition / age +2.5/5.0
- Appreciation +0.0/10.0
$204,900
🖨 Deal sheet 📄 Offer letter ✓ Due diligence
Listing remarks MLS
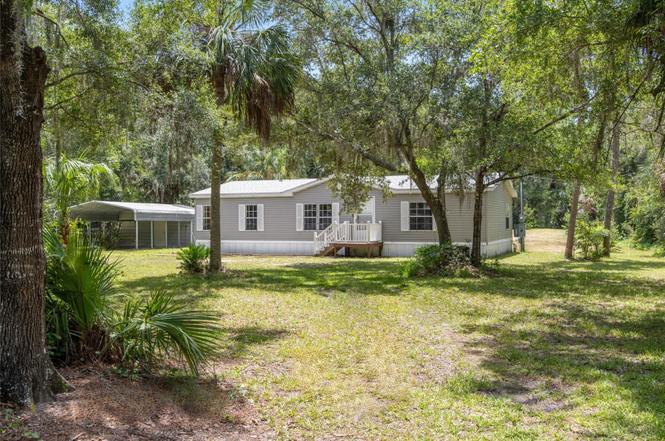
Beautiful location. This home is in great condition. Detached double carport with attached storage/workshop.
Key facts
- Generous lot
- Great location
- Spacious kitchen
Tags
Property features AI
Finance
- Other: Property is on approximately 1.08 acres; Zoned RURMH; Homestead exempt
- HOA & community: HOA: Spring Run; HOA required; HOA fee $150 annually ($12.50 monthly); Pets allowed: cats and dogs
Exterior
- Parking: Covered parking; Carport with 2 spaces
- Utilities: Well water; Septic tank; Electricity connected
- Home design: Manufactured double-wide home; One story; South-facing
- Construction: Vinyl siding; Shingle roof; Crawlspace foundation; Built as manufactured home
- Exterior features: Deck; Sliding doors; Storage building/structure; Cleared lot; Flood zone; Oversized lot; Paved surfaces
Interior
- Kitchen: Dishwasher; Range; Refrigerator
- Bedrooms: 3 bedrooms
- Bathrooms: 2 full bathrooms
- Heating & cooling: Central heating; Central air conditioning
- Interior features: Ceiling fans; Crown molding; Eat-in kitchen; Split bedroom floorplan; Walk-in closets; Electric fireplace; Inside utility
- Laundry & utility: Laundry inside
Neighborhood map
What this means for you Summary
Snapshot
- This is a 3-bed/2.0-bath manufactured listed at $205k.
Deal economics
- At list price, monthly cash flow is $-62 ($-740/yr) — negative.
- To cash-flow at today's rent, offer at most $194k (5.3% below list).
- Meets the 1% rule at list price ($2k rent vs $205k).
- Recommended offer: $180k (12.0% below list) — sets the bar for market timing.
- Cap rate 8.4% vs local median 2.1% in Crystal River — top-decile yield for the area; either an underpriced asset or a hidden risk that comps aren't pricing in. Stress-test before assuming the spread holds.
Location & tenants
- Location reads 66/100 on livability (#603 in FL) — a middle-class / working-renter tenant base. Strengths: crime A+, cost of living A+; Watch: health & safety C-, schools D+, amenities F.
- Citrus (rural): math 49% / reading 50% proficiency, ranked #44 of 73 in FL (top 60%) — families likely to look elsewhere, expect single-tenant / working-renter base with shorter leases.
- Market conditions: 320 active listings in the ZIP; 2,443 units permitted in Citrus County in 2024 (0 in 5+ unit buildings).
- At $2,098/mo this rent would consume 50% of the median local household income ($51k/yr) (locally 264% of renters already pay >50% of income on rent) — very limited rent-growth headroom before tenants either downsize or default.
Forward outlook
- Local home prices are declining (-3.0%/yr); year-one equity from $1k of loan paydown is wiped out by about $6k of value loss. Plan a longer hold.
- Citrus County population projected to shrink 10% by 2050 — rents likely to lag national; underwrite the cash flow, not the appreciation.
Negotiation context
- It's been on market 193 days — a 12% lower offer ($180k) is reasonable based on typical stale-listing flexibility.
- 5 sale attempts since 22y ago with the ask held roughly flat each time — persistent listings suggest the price (not the market) is what's stuck; bring a comps-based counter.
Risks & watch-outs
- Watch-outs: flood insurance adds $427/mo.
- Climate carrying-cost: in FEMA flood zone AE (mandatory federal flood insurance); severe wind risk, 99% chance of damaging wind over 30y; major wildfire risk; extreme-heat days projected 7→25/yr by 2055 (HVAC capex compounding) — expect insurance premiums to compound above CPI over the hold.
Questions for the listing agent
- What do current leases actually rent for vs. the listed asking? Can we see a recent rent roll and the last 12 months of T-12 income?
- It's been on market 193 days. Have you received any prior offers? Is the seller open to a 12% concession, seller financing, or rate buy-down credit?
- What's the actual annual flood-insurance premium (NFIP or private), and is the property in a SFHA with mandatory coverage?
- What does the HOA fee cover, when was the last increase, and are there any pending special assessments or reserve-fund shortfalls?
- Why hasn't it sold? Are there any deal-killer items the seller is aware of (foundation, flood, title, zoning, code violations)?
- Is there a deadline driving the sale (1031 exchange, divorce, estate, relocation)? That informs how much negotiation room exists.
- Schools are D-rated, which usually means shorter tenancies and higher turnover. Who's the typical renter profile here, and what's been the actual vacancy rate?
- What's the average days-on-market for RENTAL listings here right now (not sales)? A rising rental-DOM trend means longer vacancies and softer asking-rent achievability than the comps imply.
- What's the recent tenant-quality profile in this submarket — average credit score on applications, eviction rate, late-payment / NSF rate, and stable-employment percentage? A property-management company in the area should have these aggregated.
- How much new for-sale + rental construction is in the pipeline within 1–3 miles? Heavy new supply typically softens prices + rents 12–24 months out; constrained supply supports both.
Investment metrics
- 1% rule
- 1.02% ✓
- Cap rate
- 8.43%
- Cash-on-cash
- 7.63%
- DSCR
- 1.34
- GRM
- 8.1
CMA / ARV
- ARV (on-the-fly)
- $184,464
- Comps found
- 1
Show comp detail 1 sale within ~0.75 mi
| Address | Dist | Beds/Ba | Sqft | Sold | Price | $/sf | Match |
|---|---|---|---|---|---|---|---|
| 10046 W Montyce Ct | 0.43mi | 3/2.0 | 1,728 (+14%) | 4mo | $210,000 | $122 | 53 |
Match score weights: distance 35% · size 25% · config 20% · recency 20%. Top-matched comps best support the ARV.
Projected returns pro-forma
-3.0% appreciation · 3.0% rent growth · sell at horizon
- IRR
- -18.3%
- Equity multiple
- 0.36×
- Total profit
- $-36,915
- Equity at exit
- $30,551
- IRR
- -10.4%
- Equity multiple
- 0.37×
- Total profit
- $-36,319
- Equity at exit
- $17,716
Cash invested: $57,372 (down + closing). Projections, not guarantees.
Landlord ↔ Tenant lean methodology
- Overall (STATE)
- 87 Strongly Landlord-Friendly
- State Florida
- 87 Strongly Landlord-Friendly · R+3
- County
- — inherits STATE
- City
- — inherits STATE
ZIP-level market 34428
- Home prices YoY
- -15.3%
- Active inventory
- 320
- Price-to-rent
- 8.1×
Monthly cashflow live
- Estimated rent
- $2,098 medium interval (Pro) →
- Mortgage (P&I)
- −$1,075
- Tax from tax record
- −$121 /mo · $1,449/yr
- Insurance
- −$85
- Flood insurance flood zone
- −$427 /mo · $5,118/yr
- HOA
- −$12
- Vacancy / Maint / Mgmt
- −$441
- Net cashflow
- $-62
Break-even live
UW: 25.0% down · 7.5% · 30yr · 1.5% tax · 5.0% vac · 8.0% maint · 8.0% mgmt
Financing live
Cash to close
- Down payment
- $51,225
- Closing costs
- $6,147
- Reserves months
- —
- Total cash needed
- —
Loan-product check · same deal, 3 products live
Conventional
25% down · 7.5% · 30yr
- Down + closing
- —
- Monthly P&I
- —
- Monthly cashflow
- —
- DSCR
- —
- Eligible?
- —
Personal DTI + credit; lowest rate.
DSCR
20% down · 8.5% · 30yr
- Down + closing
- —
- Monthly P&I
- —
- Monthly cashflow
- —
- DSCR
- —
- Eligible?
- —
No personal income docs; deal must DSCR.
Hard money
10% down · 12.0% · 12mo
- Down + closing
- —
- Monthly P&I
- —
- Monthly cashflow
- —
- DSCR
- —
- Eligible?
- —
Short-term bridge; refi at stabilization.
HOA detail
- Monthly dues
- $12 · $144/yr
Listing history 31 events
-
2026-06-19days on market $204,900 Active 193 DOM
-
2026-06-18days on market $204,900 Active 192 DOM
-
2026-06-17days on market $204,900 Active 191 DOM
-
2026-06-16days on market $204,900 Active 190 DOM
-
2026-06-15days on market $204,900 Active 189 DOM
-
2026-06-14days on market $204,900 Active 187 DOM
-
2026-06-13days on market $204,900 Active 186 DOM
-
2026-06-09days on market $204,900 Active 183 DOM
-
2026-06-08days on market $204,900 Active 182 DOM
-
2026-06-03days on market $204,900 Active 177 DOM
-
2026-06-02days on market $204,900 Active 176 DOM
-
2026-06-01days on market $204,900 Active 175 DOM
-
2026-05-31days on market $204,900 Active 174 DOM
-
2026-05-30days on market $204,900 Active 173 DOM
-
2026-04-20price $204,900
-
2025-12-08$209,900 Active
-
2025-11-01historical
-
2025-09-03price $209,500
-
2025-08-20price $215,000
-
2025-07-16$219,000 Active
-
2022-10-13soldstatus $185,000
-
2021-07-08soldstatus $155,000
-
2014-07-15soldstatus $67,000
-
2014-07-01soldstatus $67,000 108-char remark
Show marketing remark (108 chars)
Beautiful location. This home is in great condition. Detached double carport with attached storage/workshop.
-
2014-04-21$69,900 108-char remark
Show marketing remark (108 chars)
Beautiful location. This home is in great condition. Detached double carport with attached storage/workshop.
-
2006-07-06soldstatus $127,000
-
2006-07-03soldstatus $127,000
-
2006-05-12$127,500
-
2005-06-03soldstatus $109,900
-
2005-01-03soldstatus $8,500
-
2004-12-07$11,000
ⓘ Source: listings_history table (triggers on properties + properties_extension) + one-shot
backfill from property_details.listing_events for pre-trigger history.
Tax reassessment forecast FL · Resets to sale price
- Current annual tax
- $1,449 · $121/mo
- Projected year-2 tax
- $1,701 · $142/mo
- Expected delta
- +$252/yr (+$21/mo · 17.4%)
ⓘ Screening estimate from a state-policy table — verify with the county assessor before closing.
Climate risk First Street
- Flood 9/10 Extreme FEMA zone AE · 99% chance over 30 yrs
- Wildfire 7/10 Severe
- Heat 9/10 Extreme 7 d/yr ≥109°F today · 25 d/yr by 30 yrs out
- Wind 9/10 Extreme 99% chance of damaging wind over 30 yrs
- Air quality 1/10 Low 0 unhealthy d/yr today · 0 by 30 yrs out
Nearby sold comps map
Loading sold comps map…
Walkable amenities ~0.75 mi
Loading nearby amenities…
Taxation est. · year 1
- Rental income
- $25,177
- − Mortgage interest
- −$11,478
- − Property taxes
- −$1,449
- − Insurance
- −$6,143
- − Repairs & maintenance
- −$2,014
- − Management
- −$2,014
- − HOA
- −$144
- − Depreciation
- −$5,961
- Taxable loss
- −$4,026
- Est. tax savings @ 24.0%
- +$966
- After-tax cash flow
- $226/yr
For passive investors: Depreciation is non-cash, so a rental often shows a tax loss while cash-flowing — sheltering income. Rental losses are passive: they offset passive income freely, and up to $25,000/yr can offset ordinary (W-2) income if you actively participate and your MAGI is under $100k (phasing out to $0 by $150k); unused losses carry forward. On sale, claimed depreciation is recaptured at up to 25%, and gains may owe capital-gains tax (a 1031 exchange can defer both). Figures are a year-1 estimate at your 24.0% rate — not tax advice; consult a CPA.
Schools (NCES district)
- District
- Citrus
- NCES district ID
- 1200270
- Math proficiency
- 49% ▼ -10.00%
- Reading proficiency
- 50% ▼ -6.00%
- Median HH income
- $38,618
- Composite
- 41.28/100
- National rank
- #3519
- State rank
- #44 of 73 in FL
Livability — Crystal River
- Score
- 66/100
- State rank
- #603
- US rank
- #11564
Category grades
Schools grade is shown separately in the Schools card above.
Census & demographics
- County
- Citrus County · 111,314 people
- City population
- 10,163
- Metro
- Homosassa Springs, FL
- Population (ZIP)
- 10,163
- Household income
- $50,779
- Rent vs Own
- Severe rent burden
- 264.0
Population outlook (Citrus County) Hauer SSP2
- Today (2025)
- 138,622 people
- By 2030
- 136,886 · -1.3%
- By 2040
- 132,009 · -4.8%
- By 2050
- 125,196 · -9.7%
- By 2075
- 108,570 · -21.7%
- By 2100
- 84,454 · -39.1%
Race, ethnicity, and origin ACS 2023
- Neighborhood character
- Predominantly White (88%)
- Race & ethnicity
- White 88% Two or more races 6% Hispanic / Latino 5% Asian 2%
- Common ancestry
- Lithuanian 3% Romanian 3% Slovak 2%
- Foreign-born
- 5% · Canada, Jamaica, South Korea
- Languages at home
- 96% English-only · Spanish 3%
Political lean MEDSL · Citrus
- 2024 margin
- Solid R (+45.9) · D 26.8% · R 72.6%
- 2008→2024 swing
- -29.8pp toward R · 2008: -16.1pp · 2024: -45.9pp
- All cycles
- 2024: R+45.9 2020: R+41.0 2016: R+39.7 2012: R+21.9 2008: R+16.1
Not yet ingested
- Civics
- —
Market trends
- HPI YoY
- ▼ -57.32%
- Current HPI
- 317.7637
- Rent YoY
- —
- Metro
- Homosassa Springs, FL
- State GDP YoY
- ▲ 3.28%
- F500 in state
- 36
Industry mix (Fortune 500 HQ in FL)
| Industry | F500 HQs | Revenue |
|---|---|---|
| Industrial Technology | 2 | $29B |
|
||
| Insurance | 2 | $17B |
|
||
| Retail | 1 | $60B |
|
||
| Technology Distribution | 1 | $58B |
|
||
| Homebuilding | 1 | $35B |
|
||
| Technology Manufacturing | 1 | $35B |
|
||
Price history
+1762.7% since first listed17 events — show timeline
- 2026-04-20 Price Changed $204,900 Stellar MLS as Distributed by MLS Grid
- 2025-12-08 Listed $209,900 Stellar MLS as Distributed by MLS Grid
- 2025-11-01 Listing Removed — Stellar MLS as Distributed by MLS Grid
- 2025-09-03 Price Changed $209,500 Stellar MLS as Distributed by MLS Grid
- 2025-08-20 Price Changed $215,000 Stellar MLS as Distributed by MLS Grid
- 2025-07-16 Listed $219,000 Stellar MLS as Distributed by MLS Grid
- 2022-10-13 Sold (Public Records) $185,000 Public Records
- 2021-07-08 Sold (Public Records) $155,000 Public Records
- 2014-07-15 Sold (Public Records) $67,000 Public Records
- 2014-07-01 Sold (MLS) $67,000 RACC
- 2014-04-21 Listed $69,900 RACC
- 2006-07-06 Sold (Public Records) $127,000 Public Records
- 2006-07-03 Sold (MLS) $127,000 RACC
- 2006-05-12 Listed $127,500 RACC
- 2005-06-03 Sold (Public Records) $109,900 Public Records
- 2005-01-03 Sold (MLS) $8,500 RACC
- 2004-12-07 Listed $11,000 RACC
Property tax history
+5.7%/yrLatest (2025): $1,449 · +6.7% YoY. Source: county tax records.
Cash-flow waterfall
monthlySold comps — $/sqft
last 12 mo · ≤1 miLoading sold comps…