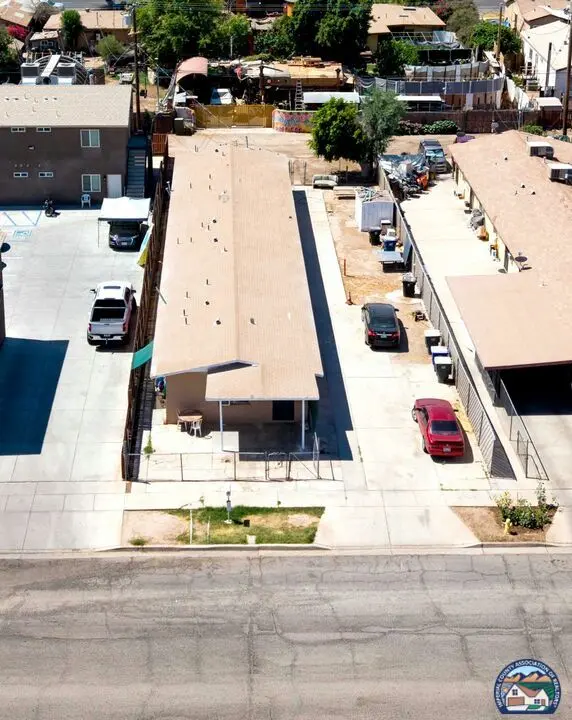
942 E G St
Brawley, CA 92227
$550,000D
20 bd · 25.0 ba ·
2,247 sqft ·
Built 1964
· MultiFamily
· Active
· 6 DOM
Cashflow @ list (25.0% down · 7.5%)
Estimated rent
$4,810/mo
Mortgage (P&I)
−$2,884
Tax + insurance
−$917
HOA
−$0
Vac / Maint / Mgmt
−$1,010
Net cashflow
$-1/mo
Annual
$-12/yr
Cap rate
6.29%
Cash-on-cash
-0.01%
DSCR
1.00
1% rule
0.87%
Cash to close
$154,000
Investor read
- This is a 5 × 1-bed/1.0-bath units multifamily listed at $550k. Condition is rated good.
- At list price, monthly cash flow is $-1 ($-12/yr) — negative. Per door: $0/mo.
- To cash-flow at today's rent, offer at most $550k (0.0% below list).
- To meet the 1% rule (rent ≥ 1% of price), the offer needs to be $481k (12.5% below list).
- Only 6 days on market — expect competitive offers; lowballing is unlikely to land.
- Recommended offer: $481k (12.5% below list) — sets the bar for 1% rule.
- Local home prices are declining (-3.0%/yr); year-one equity from $4k of loan paydown is wiped out by about $16k of value loss. Plan a longer hold.
- Location reads 56/100 on livability (#815 in CA) — a working-class tenant base; expect higher turnover. Strengths: housing A+, crime B; Watch: schools C-, cost of living D+, amenities F.
- Brawley Union High (town): math 24% / reading 48% proficiency, ranked #276 of 517 in CA (top 53%) — families likely to look elsewhere, expect single-tenant / working-renter base with shorter leases.
- Market conditions: 101 active listings in the ZIP; 271 units permitted in Imperial County in 2024 (112 in 5+ unit buildings).
- Imperial County population projected at +7% by 2050 — modest demand growth; plan on rents tracking national, not racing it.
- Climate carrying-cost: extreme-heat days projected 7→20/yr by 2055 (HVAC capex compounding) — expect insurance premiums to compound above CPI over the hold.
- Cap rate 6.3% vs local median 2.8% in Brawley — top-decile yield for the area; either an underpriced asset or a hidden risk that comps aren't pricing in. Stress-test before assuming the spread holds.
- At $4,810/mo this rent would consume 97% of the median local household income ($59k/yr) (locally 1118% of renters already pay >50% of income on rent) — very limited rent-growth headroom before tenants either downsize or default.
Questions for listing agent
- What do current leases actually rent for vs. the listed asking? Can we see a recent rent roll and the last 12 months of T-12 income?
- Can we see the unit-by-unit rent roll, current vacancy, and any below-market leases? What's the average tenancy length?
- What capital expenditures (roof, boiler, parking lot, exteriors) have been made in the last 5 years, and what's planned in the next 2?
- Built in 1964 — when were the roof, HVAC, electrical panel, plumbing, and water heater last replaced?
- Is there a deadline driving the sale (1031 exchange, divorce, estate, relocation)? That informs how much negotiation room exists.
- The area grade is low — what's the realistic commute time and amenity access for the typical tenant pool here? Any planned neighborhood developments (good or bad) we should know about?
- What's the average days-on-market for RENTAL listings here right now (not sales)? A rising rental-DOM trend means longer vacancies and softer asking-rent achievability than the comps imply.
- What's the recent tenant-quality profile in this submarket — average credit score on applications, eviction rate, late-payment / NSF rate, and stable-employment percentage? A property-management company in the area should have these aggregated.
Repairs flagged (vision-AI assessment)
- Minor: Paint — Paint on interior walls and cabinets may need touch-ups.
- Minor: Landscaping — Some areas of landscaping need trimming and maintenance.
CashFlowRE · CFR-60P7B2BFJEGD72
· Data 1 day ago
cashflowre.app · 2026-05-29