 5-Plex
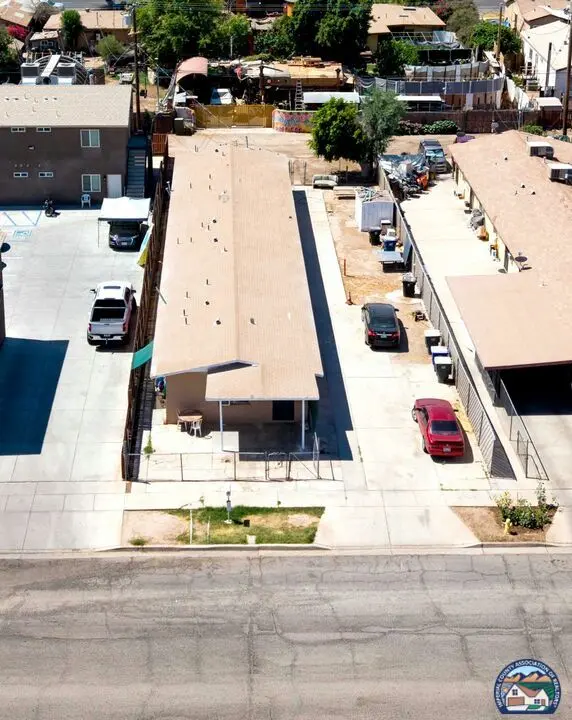
942 E G St · Brawley, CA
Flood risk 1/10 · Minimal
- FEMA flood zone
- X (unshaded)
- Chance of flooding over 30 yrs
- 0.0%
- Est. flood insurance / yr
- $507 – $1,088
Fire risk 3/10 · Minor
- Est. fire insurance / yr
- $659 – $1,223
Heat risk 10/10 · Severe
- Hot days now (above 114°F)
- 7 days/yr
- Hot days in 30 yrs
- 20 days/yr
Wind risk 1/10 · Minimal
- Chance of severe wind over 30 yrs
- —
Air-quality risk 3/10 · Minor
- Unhealthy air days now
- 3 days/yr
- Unhealthy air days in 30 yrs
- 4 days/yr
Risk factors via First Street. Map © Google.
Why this score? — see what drove the D grade
The composite is a weighted blend of 9 inputs, each scored 0–100. Each bar is that input's sub-score; the figure is the points it added to the 100-point composite (weight × sub-score).
- Cash flow +13.3/30.0
- ARV discount +7.5/15.0
- DSCR +4.0/10.0
- Condition / age +3.8/5.0
- 1% rule +3.7/10.0
- Schools +3.0/10.0
- Livability +2.8/5.0
- Rent growth +2.5/5.0
- Appreciation +0.0/10.0
$550,000
🖨 Deal sheet 📄 Offer letter ✓ Due diligence
Multi-family units
County records classify this as Multi-Family (5+ Unit). Listing-text estimate: 5 units. confirmed
5+ unit building — per-unit beds/baths from public records are typically unavailable; the breakdown below (if shown) is an estimate from the listing text.
Listing remarks
This is an exceptional chance to invest in a lucrative income-generating property. Rarely will you come across a 5-unit property. This property features 4 spacious 1-bedroom apartments and a convenient studio unit. This property also has concrete block exterior walls to enhance durability and desirability. Situated in an up-and-coming area with new developments springing up nearby, this property is the perfect investment opportunity.
Key facts
- 5 unit property
- 7,660 sq ft lot
- 5 parking spots
Tags
Property features AI
Finance
- Other: Lot size approximately 0.176 acre
Exterior
- Parking: Five total parking spaces; Gravel parking and on-street parking available
- Utilities: Public water; Public sewer
- Home design: Single-story; Residential income property
- Construction: Composition/Shingle roof
- Exterior features: Composition shingle roof; Zoned R-3
Interior
- Flooring: Carpet; Vinyl; Tile
- Heating & cooling: Window unit(s) for cooling; No central heating
- Interior features: Gas water heater; Carpet, vinyl and tile flooring
Neighborhood map
What this means for you Summary
Snapshot
- This is a 5 × 1-bed/1.0-bath units multifamily listed at $550k. Condition is rated good.
Deal economics
- At list price, monthly cash flow is $-1 ($-12/yr) — negative. Per door: $0/mo.
- To cash-flow at today's rent, offer at most $550k (0.0% below list).
- To meet the 1% rule (rent ≥ 1% of price), the offer needs to be $481k (12.5% below list).
- Recommended offer: $481k (12.5% below list) — sets the bar for 1% rule.
- Cap rate 6.3% vs local median 2.8% in Brawley — top-decile yield for the area; either an underpriced asset or a hidden risk that comps aren't pricing in. Stress-test before assuming the spread holds.
Location & tenants
- Location reads 56/100 on livability (#815 in CA) — a working-class tenant base; expect higher turnover. Strengths: housing A+, crime B; Watch: schools C-, cost of living D+, amenities F.
- Brawley Union High (town): math 24% / reading 48% proficiency, ranked #276 of 517 in CA (top 53%) — families likely to look elsewhere, expect single-tenant / working-renter base with shorter leases.
- Market conditions: 101 active listings in the ZIP; 271 units permitted in Imperial County in 2024 (112 in 5+ unit buildings).
- At $4,810/mo this rent would consume 97% of the median local household income ($59k/yr) (locally 1118% of renters already pay >50% of income on rent) — very limited rent-growth headroom before tenants either downsize or default.
Forward outlook
- Local home prices are declining (-3.0%/yr); year-one equity from $4k of loan paydown is wiped out by about $16k of value loss. Plan a longer hold.
- Imperial County population projected at +7% by 2050 — modest demand growth; plan on rents tracking national, not racing it.
Negotiation context
- Only 6 days on market — expect competitive offers; lowballing is unlikely to land.
Risks & watch-outs
- Climate carrying-cost: extreme-heat days projected 7→20/yr by 2055 (HVAC capex compounding) — expect insurance premiums to compound above CPI over the hold.
Questions for the listing agent
- What do current leases actually rent for vs. the listed asking? Can we see a recent rent roll and the last 12 months of T-12 income?
- Can we see the unit-by-unit rent roll, current vacancy, and any below-market leases? What's the average tenancy length?
- What capital expenditures (roof, boiler, parking lot, exteriors) have been made in the last 5 years, and what's planned in the next 2?
- Built in 1964 — when were the roof, HVAC, electrical panel, plumbing, and water heater last replaced?
- Is there a deadline driving the sale (1031 exchange, divorce, estate, relocation)? That informs how much negotiation room exists.
- The area grade is low — what's the realistic commute time and amenity access for the typical tenant pool here? Any planned neighborhood developments (good or bad) we should know about?
- What's the average days-on-market for RENTAL listings here right now (not sales)? A rising rental-DOM trend means longer vacancies and softer asking-rent achievability than the comps imply.
- What's the recent tenant-quality profile in this submarket — average credit score on applications, eviction rate, late-payment / NSF rate, and stable-employment percentage? A property-management company in the area should have these aggregated.
- How much new apartment / multifamily construction is in the pipeline within 1–3 miles? Heavy new supply (>2% of stock underway) typically softens rents 12–24 months out; light construction supports rent growth.
Investment metrics
- 1% rule
- 0.87% ✗
- Cap rate
- 6.29%
- Cash-on-cash
- -0.01%
- DSCR
- 1.00
- GRM
- 9.5
CMA / ARV
No comps found within radius.
Projected returns pro-forma
-3.0% appreciation · 3.0% rent growth · sell at horizon
- IRR
- -16.3%
- Equity multiple
- 0.42×
- Total profit
- $-89,116
- Equity at exit
- $82,007
- IRR
- -8.0%
- Equity multiple
- 0.50×
- Total profit
- $-77,390
- Equity at exit
- $47,554
Cash invested: $154,000 (down + closing). Projections, not guarantees.
Landlord ↔ Tenant lean methodology
- Overall (STATE)
- 18 Strongly Tenant-Friendly
- State California
- 18 Strongly Tenant-Friendly · D+13
- County
- — inherits STATE
- City
- — inherits STATE
ZIP-level market 92227
- Home prices YoY
- -17.3%
- Active inventory
- 101
- Price-to-rent
- 47.6×
Monthly cashflow live
- Estimated rent
- $4,810 medium interval (Pro) →
- Mortgage (P&I)
- −$2,884
- Tax est. 1.5%
- −$688 /mo · $8,250/yr
- Insurance
- −$229
- HOA
- −$0
- Vacancy / Maint / Mgmt
- −$1,010
- Net cashflow
- $-1
Break-even live
5-unit breakdown (identical units grouped — click to expand)
| Units | Beds | Baths | Est. rent |
|---|---|---|---|
| 5× units | 1 | 1 | $4,810 |
| #1 | 1 | 1 | $962 |
| #2 | 1 | 1 | $962 |
| #3 | 1 | 1 | $962 |
| #4 | 1 | 1 | $962 |
| #5 | 1 | 1 | $962 |
| Total (5 units) | $4,810 | ||
UW: 25.0% down · 7.5% · 30yr · 1.5% tax · 5.0% vac · 8.0% maint · 8.0% mgmt
Financing live
Cash to close
- Down payment
- $137,500
- Closing costs
- $16,500
- Reserves months
- —
- Total cash needed
- —
Loan-product check · same deal, 3 products live
Conventional
25% down · 7.5% · 30yr
- Down + closing
- —
- Monthly P&I
- —
- Monthly cashflow
- —
- DSCR
- —
- Eligible?
- —
Personal DTI + credit; lowest rate.
DSCR
20% down · 8.5% · 30yr
- Down + closing
- —
- Monthly P&I
- —
- Monthly cashflow
- —
- DSCR
- —
- Eligible?
- —
No personal income docs; deal must DSCR.
Hard money
10% down · 12.0% · 12mo
- Down + closing
- —
- Monthly P&I
- —
- Monthly cashflow
- —
- DSCR
- —
- Eligible?
- —
Short-term bridge; refi at stabilization.
Listing history 7 events
-
2026-06-19days on market $550,000 Active 6 DOM
-
2026-06-18days on market $550,000 Active 5 DOM
-
2026-06-17days on market $550,000 Active 4 DOM
-
2026-06-16days on market $550,000 Active 3 DOM
-
2026-06-15days on market $550,000 Active 2 DOM
-
2026-06-14remarks 437-char remark
-
2026-06-14$550,000 Active 1 DOM
ⓘ Source: listings_history table (triggers on properties + properties_extension) + one-shot
backfill from property_details.listing_events for pre-trigger history.
Climate risk First Street
- Flood 1/10 Low FEMA zone X (unshaded) · 0% chance over 30 yrs
- Wildfire 3/10 Moderate
- Heat 10/10 Extreme 7 d/yr ≥114°F today · 20 d/yr by 30 yrs out
- Wind 1/10 Low
- Air quality 3/10 Moderate 3 unhealthy d/yr today · 4 by 30 yrs out
Nearby sold comps map
Loading sold comps map…
Walkable amenities ~0.75 mi
Loading nearby amenities…
Taxation est. · year 1
- Rental income
- $57,720
- − Mortgage interest
- −$30,809
- − Property taxes
- −$8,250
- − Insurance
- −$2,750
- − Repairs & maintenance
- −$4,618
- − Management
- −$4,618
- − Depreciation
- −$16,000
- Taxable loss
- −$9,324
- Est. tax savings @ 24.0%
- +$2,238
- After-tax cash flow
- $2,225/yr
For passive investors: Depreciation is non-cash, so a rental often shows a tax loss while cash-flowing — sheltering income. Rental losses are passive: they offset passive income freely, and up to $25,000/yr can offset ordinary (W-2) income if you actively participate and your MAGI is under $100k (phasing out to $0 by $150k); unused losses carry forward. On sale, claimed depreciation is recaptured at up to 25%, and gains may owe capital-gains tax (a 1031 exchange can defer both). Figures are a year-1 estimate at your 24.0% rate — not tax advice; consult a CPA.
Condition & rehab AI · 12 photos
This 5-unit multi-family property is in good condition with minimal repairs needed. It offers a great investment opportunity in a developing area with potential for rental or resale value enhancement.
Repairs flagged
- Minor Paint — Paint on interior walls and cabinets may need touch-ups.
- Minor Landscaping — Some areas of landscaping need trimming and maintenance.
Value-add opportunities
- Both Paint interior walls and cabinets — Fresh paint enhances curb appeal and interior aesthetics.
- Both Landscaping and yard maintenance — A well-maintained exterior boosts curb appeal and property value.
- Both Update kitchen and bathroom fixtures — Modern fixtures improve functionality and appeal to potential buyers/tenants.
Renovation cost estimate screening
| Repair item | Severity | Est. cost |
|---|---|---|
| Paint · Paint on interior walls and cabinets may need touch-ups. | Minor | $500–3,000 |
| Landscaping · Some areas of landscaping need trimming and maintenance. | Minor | $500–3,000 |
| Total estimated repair cost · 2 items | $1,000–6,000 |
Value-add ROI direction
- Both Paint interior walls and cabinets — Fresh paint enhances curb appeal and interior aesthetics. ↑
- Both Landscaping and yard maintenance — A well-maintained exterior boosts curb appeal and property value. ↑
- Both Update kitchen and bathroom fixtures — Modern fixtures improve functionality and appeal to potential buyers/tenants. ↑
ⓘ Cost ranges are severity-bucket heuristics (US national rule-of-thumb). Get contractor quotes + a written scope before underwriting a rehab budget.
Schools (NCES district)
- District
- Brawley Union High
- NCES district ID
- 0605820
- Math proficiency
- 24% ▼ -8.00%
- Reading proficiency
- 48% ▼ -6.00%
- Median HH income
- $40,012
- Composite
- 30.13/100
- National rank
- #6331
- State rank
- #276 of 517 in CA
Livability — Brawley
- Score
- 56/100
- State rank
- #815
- US rank
- #22973
Category grades
Schools grade is shown separately in the Schools card above.
Census & demographics
- Census place
- Brawley, CA
- County
- Imperial County · 104,838 people
- City population
- 28,315
- Metro
- El Centro, CA
- Population (ZIP)
- 28,315
- Household income
- $59,362
- Rent vs Own
- Severe rent burden
- 1118.0
Population outlook (Imperial County) Hauer SSP2
- Today (2025)
- 186,713 people
- By 2030
- 190,022 · +1.8%
- By 2040
- 195,993 · +5.0%
- By 2050
- 199,534 · +6.9%
- By 2075
- 216,878 · +16.2%
- By 2100
- 352,705 · +88.9%
Race, ethnicity, and origin ACS 2023
- Neighborhood character
- Predominantly Hispanic (84%)
- Race & ethnicity
- Hispanic / Latino 84% Two or more races 25% White 13% Native American 2% Asian 1%
- Hispanic origin (detail)
- Mexican 82%
- Foreign-born
- 28% · Canada, China
- Languages at home
- 34% English-only · Spanish 65%
Political lean MEDSL · Imperial
- 2024 margin
- Toss-up / Even · D 48.3% · R 49.1% · Other 2.6%
- 2008→2024 swing
- -27.0pp toward R · 2008: 26.2pp · 2024: -0.9pp
- All cycles
- 2024: R+0.9 2020: D+24.4 2016: D+41.1 2012: D+28.8 2008: D+26.2
Not yet ingested
- Civics
- —
Market trends
- HPI YoY
- ▼ -64.80%
- Current HPI
- 309.2652
- Rent YoY
- —
- Metro
- El Centro, CA
- State GDP YoY
- ▲ 3.21%
- F500 in state
- 116
Industry mix (Fortune 500 HQ in CA)
| Industry | F500 HQs | Revenue |
|---|---|---|
| Technology | 27 | $1,492B |
|
||
| Financial Services | 3 | $174B |
|
||
| Retail | 3 | $44B |
|
||
| Insurance | 3 | $26B |
|
||
| Media / Entertainment | 2 | $115B |
|
||
| Pharmaceuticals / Biotech | 2 | $62B |
|
||
Price history
1 event — show timeline
- 2026-06-13 Listed $550,000 ICAOR
Cash-flow waterfall
monthlySold comps — $/sqft
last 12 mo · ≤1 miLoading sold comps…