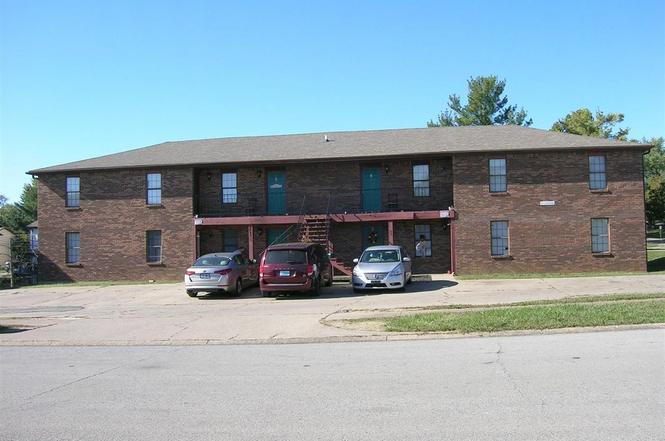
2845 Frontier Ct
Radcliff, KY 40160
$800,000D
96 bd · None ba ·
— sqft ·
Built 1985
· MultiFamily
· Active
· 620 DOM
Cashflow @ list (25.0% down · 7.5%)
Estimated rent
$7,348/mo
Mortgage (P&I)
−$4,195
Tax + insurance
−$1,333
HOA
−$0
Vac / Maint / Mgmt
−$1,543
Net cashflow
$276/mo
Annual
$3,316/yr
Cap rate
6.71%
Cash-on-cash
1.48%
DSCR
1.07
1% rule
0.92%
Cash to close
$224,000
Investor read
- This is a 8 × 2-bed/1.5-bath units multifamily listed at $800k.
- At list price, monthly cash flow is $276 ($3k/yr) — positive. Per door: $35/mo.
- The deal already cash-flows at list — no discount required.
- To meet the 1% rule (rent ≥ 1% of price), the offer needs to be $735k (8.2% below list).
- It's been on market 620 days — a 12% lower offer ($704k) is reasonable based on typical stale-listing flexibility.
- Recommended offer: $704k (12.0% below list) — sets the bar for market timing.
- Local home prices are declining (-3.0%/yr); year-one equity from $6k of loan paydown is wiped out by about $24k of value loss. Plan a longer hold.
- Location reads 61/100 on livability (#367 in KY) — a middle-class / working-renter tenant base. Strengths: cost of living A+, housing A+, crime B; Watch: amenities F, commute F, employment F.
- Hardin County (suburban): math 30% / reading 43% proficiency, ranked #47 of 165 in KY (top 28%) — families likely to look elsewhere, expect single-tenant / working-renter base with shorter leases.
- Zoned schools: New Highland Elementary School (math 22% / reading 27%, grade F, #489 of 676 statewide, top 76%, 501 students, 62% FRL); Bluegrass Middle School (math 22% / reading 40%, grade F, #138 of 217 statewide, top 65%, 578 students, 52% FRL); John Hardin High School (math 27% / reading 42%, grade F, #76 of 254 statewide, top 34%, 790 students, 52% FRL).
- Market conditions: Rents rising (+2.2%/yr); 176 active listings in the ZIP; 946 units permitted in Hardin County in 2024 (464 in 5+ unit buildings).
- Hardin County population projected at -16% by 2050 — secular population decline; favor cash flow + early exit over multi-decade hold.
- Cap rate 6.7% vs local median 3.5% in Radcliff — top-decile yield for the area; either an underpriced asset or a hidden risk that comps aren't pricing in. Stress-test before assuming the spread holds.
- At $7,348/mo this rent would consume 151% of the median local household income ($59k/yr) (locally 638% of renters already pay >50% of income on rent) — very limited rent-growth headroom before tenants either downsize or default.
Questions for listing agent
- It's been on market 620 days. Have you received any prior offers? Is the seller open to a 12% concession, seller financing, or rate buy-down credit?
- Can we see the unit-by-unit rent roll, current vacancy, and any below-market leases? What's the average tenancy length?
- What capital expenditures (roof, boiler, parking lot, exteriors) have been made in the last 5 years, and what's planned in the next 2?
- Why hasn't it sold? Are there any deal-killer items the seller is aware of (foundation, flood, title, zoning, code violations)?
- Is there a deadline driving the sale (1031 exchange, divorce, estate, relocation)? That informs how much negotiation room exists.
- Schools are D-rated, which usually means shorter tenancies and higher turnover. Who's the typical renter profile here, and what's been the actual vacancy rate?
- The area grade is low — what's the realistic commute time and amenity access for the typical tenant pool here? Any planned neighborhood developments (good or bad) we should know about?
- What's the average days-on-market for RENTAL listings here right now (not sales)? A rising rental-DOM trend means longer vacancies and softer asking-rent achievability than the comps imply.
CashFlowRE · CFR-61H9XY5118DT5X
· Data 2 h ago
cashflowre.app · 2026-05-29