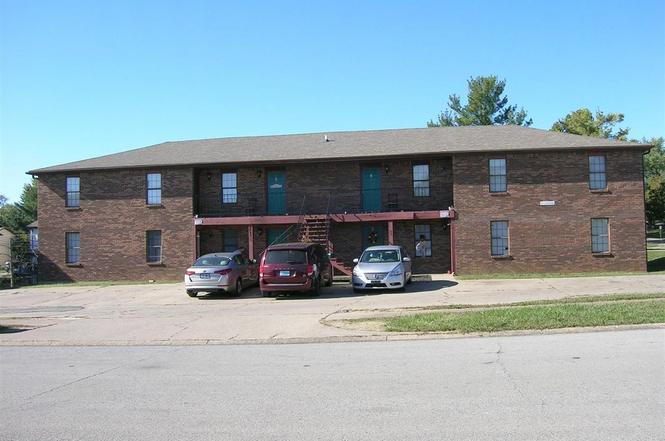
 8-Plex
2845 Frontier Ct · Radcliff, KY
Flood risk No data
- FEMA flood zone
- —
- Chance of flooding over 30 yrs
- —
- Est. flood insurance / yr
- —
Fire risk No data
- Est. fire insurance / yr
- —
Heat risk No data
- Hot days now (above threshold)
- —
- Hot days in 30 yrs
- —
Wind risk No data
- Chance of severe wind over 30 yrs
- —
Air-quality risk No data
- Unhealthy air days now
- —
- Unhealthy air days in 30 yrs
- —
Risk factors via First Street. Map © Google.
Why this score? — see what drove the D grade
The composite is a weighted blend of 9 inputs, each scored 0–100. Each bar is that input's sub-score; the figure is the points it added to the 100-point composite (weight × sub-score).
- Cash flow +15.2/30.0
- ARV discount +7.5/15.0
- DSCR +4.7/10.0
- 1% rule +4.2/10.0
- Schools +3.2/10.0
- Rent growth +3.1/5.0
- Livability +3.1/5.0
- Condition / age +2.5/5.0
- Appreciation +0.0/10.0
$800,000
🖨 Deal sheet (PDF) 📄 Offer letter ✓ Due diligence
Multi-family units
County records classify this as Multi-Family (5+ Unit). Listing-text estimate: 8 units. confirmed
5+ unit building — per-unit beds/baths from public records are typically unavailable; the breakdown below (if shown) is an estimate from the listing text.
Listing remarks
Well maintained 8 unit apartment with washer/Dryer hookup. Building has Master lease in place. Organization pays total rent for entire building. Owner pays taxes and insurance
Key facts
- Owner pays insurance
- Owner pays taxes
- 1 acre lot
Tags
Property features AI
Exterior
- Parking: 14 total parking spaces
- Home design: Multi-family residential income property
- Exterior features: 1-acre lot; Directions: From 31 W heading south turn left onto Centennial, right on Wagon Wheel, then right onto Frontier Ct — first building on the right
Interior
- Interior features: Located in the Whispering Hills subdivision
Neighborhood map
What this means for you Summary
Snapshot
- This is a 8 × 2-bed/1.5-bath units multifamily listed at $800k.
Deal economics
- At list price, monthly cash flow is $276 ($3k/yr) — positive. Per door: $35/mo.
- The deal already cash-flows at list — no discount required.
- To meet the 1% rule (rent ≥ 1% of price), the offer needs to be $735k (8.2% below list).
- Recommended offer: $704k (12.0% below list) — sets the bar for market timing.
- Cap rate 6.7% vs local median 3.5% in Radcliff — top-decile yield for the area; either an underpriced asset or a hidden risk that comps aren't pricing in. Stress-test before assuming the spread holds.
Location & tenants
- Location reads 61/100 on livability (#367 in KY) — a middle-class / working-renter tenant base. Strengths: cost of living A+, housing A+, crime B; Watch: schools D-, amenities F, commute F.
- Hardin County (suburban): math 30% / reading 43% proficiency, ranked #47 of 165 in KY (top 28%) — families likely to look elsewhere, expect single-tenant / working-renter base with shorter leases.
- Market conditions: Rents rising (+2.2%/yr); 173 active listings in the ZIP; 946 units permitted in Hardin County in 2024 (464 in 5+ unit buildings).
- At $7,348/mo this rent would consume 151% of the median local household income ($59k/yr) (locally 638% of renters already pay >50% of income on rent) — very limited rent-growth headroom before tenants either downsize or default.
Forward outlook
- Local home prices are declining (-3.0%/yr); year-one equity from $6k of loan paydown is wiped out by about $24k of value loss. Plan a longer hold.
- Hardin County population projected at -16% by 2050 — secular population decline; favor cash flow + early exit over multi-decade hold.
Negotiation context
- It's been on market 618 days — a 12% lower offer ($704k) is reasonable based on typical stale-listing flexibility.
Questions for the listing agent
- It's been on market 618 days. Have you received any prior offers? Is the seller open to a 12% concession, seller financing, or rate buy-down credit?
- Can we see the unit-by-unit rent roll, current vacancy, and any below-market leases? What's the average tenancy length?
- What capital expenditures (roof, boiler, parking lot, exteriors) have been made in the last 5 years, and what's planned in the next 2?
- Why hasn't it sold? Are there any deal-killer items the seller is aware of (foundation, flood, title, zoning, code violations)?
- Is there a deadline driving the sale (1031 exchange, divorce, estate, relocation)? That informs how much negotiation room exists.
- Schools are D-rated, which usually means shorter tenancies and higher turnover. Who's the typical renter profile here, and what's been the actual vacancy rate?
- The area grade is low — what's the realistic commute time and amenity access for the typical tenant pool here? Any planned neighborhood developments (good or bad) we should know about?
- What's the average days-on-market for RENTAL listings here right now (not sales)? A rising rental-DOM trend means longer vacancies and softer asking-rent achievability than the comps imply.
- What's the recent tenant-quality profile in this submarket — average credit score on applications, eviction rate, late-payment / NSF rate, and stable-employment percentage? A property-management company in the area should have these aggregated.
- How much new apartment / multifamily construction is in the pipeline within 1–3 miles? Heavy new supply (>2% of stock underway) typically softens rents 12–24 months out; light construction supports rent growth.
Investment metrics
- 1% rule
- 0.92% ✗
- Cap rate
- 6.71%
- Cash-on-cash
- 1.48%
- DSCR
- 1.07
- GRM
- 9.1
CMA / ARV
No comps found within radius.
Projected returns pro-forma
-3.0% appreciation · 2.2% rent growth · sell at horizon
- IRR
- -14.8%
- Equity multiple
- 0.47×
- Total profit
- $-117,794
- Equity at exit
- $119,283
- IRR
- -7.5%
- Equity multiple
- 0.54×
- Total profit
- $-103,157
- Equity at exit
- $69,169
Cash invested: $224,000 (down + closing). Projections, not guarantees.
Landlord ↔ Tenant lean methodology
- Overall (STATE)
- 83 Strongly Landlord-Friendly
- State Kentucky
- 83 Strongly Landlord-Friendly · R+16
- County
- — inherits STATE
- City
- — inherits STATE
ZIP-level market 40160
- Home prices YoY
- -14.1%
- Rents YoY
- 2.2%
- Active inventory
- 173
- Price-to-rent
- 72.6×
Monthly cashflow live
- Estimated rent
- $7,348 medium interval (Pro) →
- Mortgage (P&I)
- −$4,195
- Tax est. 1.5%
- −$1,000 /mo · $12,000/yr
- Insurance
- −$333
- HOA
- −$0
- Vacancy / Maint / Mgmt
- −$1,543
- Net cashflow
- $276
Break-even live
Sensitivity live
| Price | -10% $829 | -5% $553 | +0% $276 | +5% $0 | +10% $-277 |
|---|---|---|---|---|---|
| Rent | -10% $-304 | -5% $-14 | +0% $276 | +5% $567 | +10% $857 |
| Rate | -1.0pp $679 | -0.5pp $480 | base $276 | +0.5pp $69 | +1.0pp $-142 |
8-unit breakdown (identical units grouped — click to expand)
| Units | Beds | Baths | Est. rent |
|---|---|---|---|
| 8× units | 2 | 1.5 | $7,352 |
| #1 | 2 | 1.5 | $919 |
| #2 | 2 | 1.5 | $919 |
| #3 | 2 | 1.5 | $919 |
| #4 | 2 | 1.5 | $919 |
| #5 | 2 | 1.5 | $919 |
| #6 | 2 | 1.5 | $919 |
| #7 | 2 | 1.5 | $919 |
| #8 | 2 | 1.5 | $919 |
| Total (8 units) | $7,348 | ||
UW: 25.0% down · 7.5% · 30yr · 1.5% tax · 5.0% vac · 8.0% maint · 8.0% mgmt
Financing live
Cash to close
- Down payment
- $200,000
- Closing costs
- $24,000
- Reserves months
- —
- Total cash needed
- —
Loan-product check · same deal, 3 products live
Conventional
25% down · 7.5% · 30yr
- Down + closing
- —
- Monthly P&I
- —
- Monthly cashflow
- —
- DSCR
- —
- Eligible?
- —
Personal DTI + credit; lowest rate.
DSCR
20% down · 8.5% · 30yr
- Down + closing
- —
- Monthly P&I
- —
- Monthly cashflow
- —
- DSCR
- —
- Eligible?
- —
No personal income docs; deal must DSCR.
Hard money
10% down · 12.0% · 12mo
- Down + closing
- —
- Monthly P&I
- —
- Monthly cashflow
- —
- DSCR
- —
- Eligible?
- —
Short-term bridge; refi at stabilization.
Listing history 17 events
-
2026-06-19days on market $800,000 Active 618 DOM
-
2026-06-18days on market $800,000 Active 617 DOM
-
2026-06-17days on market $800,000 Active 616 DOM
-
2026-06-16days on market $800,000 Active 615 DOM
-
2026-06-15days on market $800,000 Active 614 DOM
-
2026-06-14days on market $800,000 Active 612 DOM
-
2026-06-13days on market $800,000 Active 611 DOM
-
2026-06-10days on market $800,000 Active 609 DOM
-
2026-06-09days on market $800,000 Active 608 DOM
-
2026-06-08days on market $800,000 Active 607 DOM
-
2026-06-07days on market $800,000 Active 606 DOM
-
2026-06-03days on market $800,000 Active 602 DOM
-
2026-06-02days on market $800,000 Active 601 DOM
-
2026-06-01days on market $800,000 Active 600 DOM
-
2026-05-31days on market $800,000 Active 599 DOM
-
2026-05-30days on market $800,000 Active 598 DOM
-
2024-10-09$800,000 Active
ⓘ Source: listings_history table (triggers on properties + properties_extension) + one-shot
backfill from property_details.listing_events for pre-trigger history.
Nearby sold comps map
Loading sold comps map…
Walkable amenities ~0.75 mi
Loading nearby amenities…
Taxation est. · year 1
- Rental income
- $88,176
- − Mortgage interest
- −$44,812
- − Property taxes
- −$12,000
- − Insurance
- −$4,000
- − Repairs & maintenance
- −$7,054
- − Management
- −$7,054
- − Depreciation
- −$23,273
- Taxable loss
- −$10,017
- Est. tax savings @ 24.0%
- +$2,404
- After-tax cash flow
- $5,720/yr
For passive investors: Depreciation is non-cash, so a rental often shows a tax loss while cash-flowing — sheltering income. Rental losses are passive: they offset passive income freely, and up to $25,000/yr can offset ordinary (W-2) income if you actively participate and your MAGI is under $100k (phasing out to $0 by $150k); unused losses carry forward. On sale, claimed depreciation is recaptured at up to 25%, and gains may owe capital-gains tax (a 1031 exchange can defer both). Figures are a year-1 estimate at your 24.0% rate — not tax advice; consult a CPA.
Schools (NCES district)
- District
- Hardin County
- NCES district ID
- 2102490
- Math proficiency
- 30% ▼ -13.00%
- Reading proficiency
- 43% ▼ -10.00%
- Median HH income
- $50,728
- Composite
- 31.61/100
- National rank
- #5945
- State rank
- #47 of 165 in KY
Livability — Radcliff
- Score
- 61/100
- State rank
- #367
- US rank
- #17445
Category grades
Schools grade is shown separately in the Schools card above.
Census & demographics
- Census place
- Radcliff, KY
- County
- Hardin County · 77,611 people
- City population
- 23,624
- Metro
- Elizabethtown-Fort Knox, KY
- Population (ZIP)
- 23,624
- Household income
- $58,506
- Rent vs Own
- Severe rent burden
- 638.0
Population outlook (Hardin County) Hauer SSP2
- Today (2025)
- 105,573 people
- By 2030
- 103,563 · -1.9%
- By 2040
- 97,077 · -8.0%
- By 2050
- 88,367 · -16.3%
- By 2075
- 65,405 · -38.0%
- By 2100
- 42,245 · -60.0%
Race, ethnicity, and origin ACS 2023
- Neighborhood character
- Diverse neighborhood (Simpson 0.57)
- Race & ethnicity
- White 61% Black 21% Hispanic / Latino 9% Two or more races 7% Asian 3%
- Hispanic origin (detail)
- Mexican 2% Puerto Rican 3%
- Common ancestry
- Slovak 2% Italian 2% Lithuanian 2%
- Foreign-born
- 5% · Canada, South Korea
- Languages at home
- 93% English-only · Spanish 4% German/W. Germanic 1% Korean 1%
Political lean MEDSL · Hardin
- 2024 margin
- Strong R (+29.3) · D 34.5% · R 63.8% · Other 1.7%
- 2008→2024 swing
- -8.7pp toward R · 2008: -20.6pp · 2024: -29.3pp
- All cycles
- 2024: R+29.3 2020: R+24.0 2016: R+30.2 2012: R+20.8 2008: R+20.6
Not yet ingested
- Civics
- —
Market trends
- HPI YoY
- ▼ -44.02%
- Current HPI
- 268.1177
- Rent YoY
- ▲ 2.20%
- Metro
- Elizabethtown-Fort Knox, KY
- State GDP YoY
- ▲ 1.81%
- F500 in state
- 4
Industry mix (Fortune 500 HQ in KY)
| Industry | F500 HQs | Revenue |
|---|---|---|
| Healthcare | 1 | $118B |
|
||
| Food / Beverage | 1 | $7B |
|
||
Price history
1 event — show timeline
- 2024-10-09 Listed $800,000 HKARMLS
Cash-flow waterfall
monthlySold comps — $/sqft
last 12 mo · ≤1 miLoading sold comps…