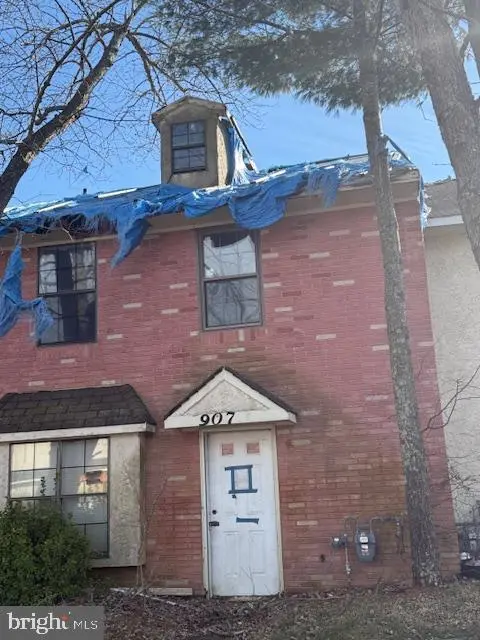
907 Blake Dr
Mays Landing, NJ 08330
$104,900A
3 bd · 1.5 ba ·
1,408 sqft ·
Built 1987
· Townhouse
· Active
· 103 DOM
Cashflow @ list (25.0% down · 7.5%)
Estimated rent
$2,612/mo
Mortgage (P&I)
−$550
Tax + insurance
−$380
HOA
−$115
Vac / Maint / Mgmt
−$548
Net cashflow
$1,018/mo
Annual
$12,214/yr
Cap rate
17.94%
Cash-on-cash
41.58%
DSCR
2.85
1% rule
2.49%
Cash to close
$29,372
Investor read
- This is a 3-bed/1.5-bath townhouse listed at $105k.
- At list price, monthly cash flow is $1k ($12k/yr) — positive.
- The deal already cash-flows at list — no discount required.
- Meets the 1% rule at list price ($3k rent vs $105k).
- It's been on market 103 days — a 9% lower offer ($95k) is reasonable based on typical stale-listing flexibility.
- Recommended offer: $95k (9.0% below list) — sets the bar for market timing.
- In year one you build about $11k of equity ($725 loan paydown + $10k appreciation (10.0% local appreciation)).
- Location reads 72/100 on livability (#214 in NJ) — a middle-class / working-renter tenant base. Strengths: housing A+, employment A, health & safety B+; Watch: commute C-, cost of living D+, amenities F.
- Weymouth Township School District (rural): math 50% / reading 55% proficiency, ranked #351 of 612 in NJ (top 57%) — acceptable for families but not a draw, mixed tenant base, ~2y average lease.
- Watch-outs: property tax is 3.8% of price.
- Market conditions: 240 active listings in the ZIP; 1 comparable units currently listed for rent nearby; solid renter incomes; 672 units permitted in Atlantic County in 2024 (258 in 5+ unit buildings).
- Atlantic County population projected at -12% by 2050 — secular population decline; favor cash flow + early exit over multi-decade hold.
- 4 sale attempts since 21y ago; this cycle's ask is 6% above the opening price — seller raised mid-cycle; expect resistance to lowballs.
- At projected returns (10.0% appreciation + 3.0% rent growth), your $29k cash investment doubles in ~2 years — after that, you're playing with house money.
- By year 4, paydown + projected appreciation supports a ~$40k cash-out refi (75% LTV) — recoverable capital for the next deal without selling this one.
- Climate carrying-cost: severe wind risk, 80% chance of damaging wind over 30y; moderate wildfire risk; extreme-heat days projected 7→15/yr by 2055 (HVAC capex compounding) — expect insurance premiums to compound above CPI over the hold.
- Cap rate 17.9% vs local median 4.0% in Mays Landing — top-decile yield for the area; either an underpriced asset or a hidden risk that comps aren't pricing in. Stress-test before assuming the spread holds.
- This rent runs 41% of the median local income ($77k/yr) — at the standard rent-burdened threshold; future hikes will face affordability resistance.
Questions for listing agent
- It's been on market 103 days. Have you received any prior offers? Is the seller open to a 9% concession, seller financing, or rate buy-down credit?
- Property tax is high relative to price — has the assessment been appealed recently, and will the sale trigger a re-assessment?
- What does the HOA fee cover, when was the last increase, and are there any pending special assessments or reserve-fund shortfalls?
- Why hasn't it sold? Are there any deal-killer items the seller is aware of (foundation, flood, title, zoning, code violations)?
- Is there a deadline driving the sale (1031 exchange, divorce, estate, relocation)? That informs how much negotiation room exists.
- What's the average days-on-market for RENTAL listings here right now (not sales)? A rising rental-DOM trend means longer vacancies and softer asking-rent achievability than the comps imply.
- What's the recent tenant-quality profile in this submarket — average credit score on applications, eviction rate, late-payment / NSF rate, and stable-employment percentage? A property-management company in the area should have these aggregated.
- How much new for-sale + rental construction is in the pipeline within 1–3 miles? Heavy new supply typically softens prices + rents 12–24 months out; constrained supply supports both.
CashFlowRE · CFR-64GKVHDJBV6FAE
· Data 1 day ago
cashflowre.app · 2026-05-29