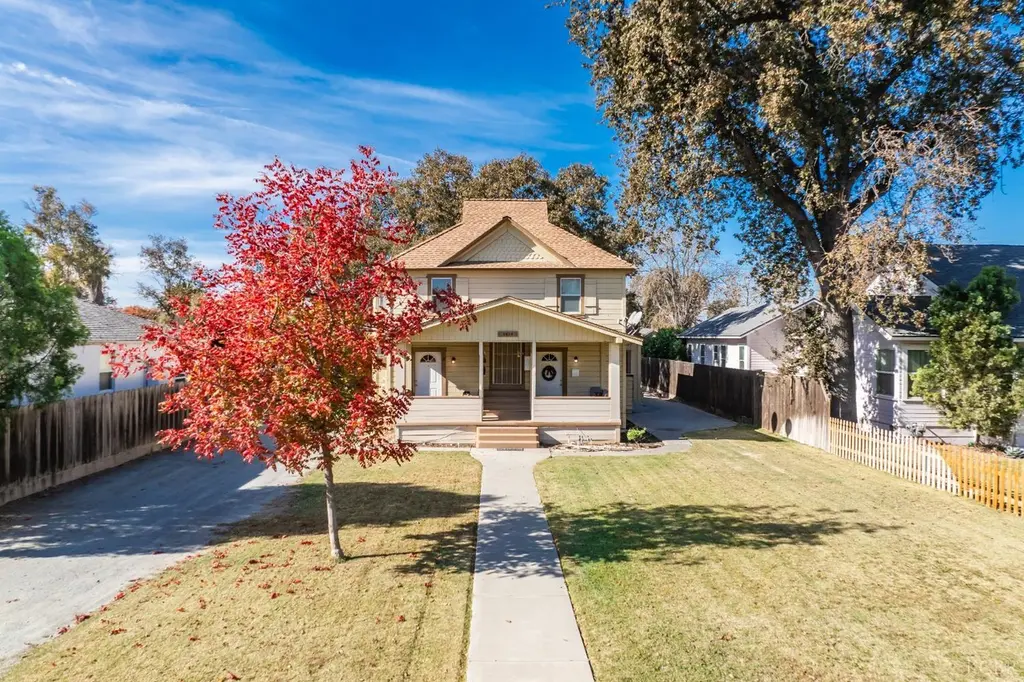
1320 N Irwin St
Hanford, CA 93230
$399,000C-
3 bd · 3.0 ba ·
1,814 sqft ·
Built 1898
· MultiFamily
· Pending
· 33 DOM
Cashflow @ list (25.0% down · 7.5%)
Estimated rent
$3,799/mo
Mortgage (P&I)
−$2,092
Tax + insurance
−$400
HOA
−$0
Vac / Maint / Mgmt
−$798
Net cashflow
$509/mo
Annual
$6,112/yr
Cap rate
7.82%
Cash-on-cash
5.47%
DSCR
1.24
1% rule
0.95%
Cash to close
$111,720
Investor read
- This is a 3 × 1-bed/1-bath units multifamily listed at $399k.
- At list price, monthly cash flow is $509 ($6k/yr) — positive. Per door: $170/mo.
- The deal already cash-flows at list — no discount required.
- To meet the 1% rule (rent ≥ 1% of price), the offer needs to be $380k (4.8% below list).
- It's been on market 33 days — a 3% lower offer ($387k) is reasonable based on typical stale-listing flexibility.
- Recommended offer: $380k (4.8% below list) — sets the bar for 1% rule.
- Local home prices are declining (-3.0%/yr); year-one equity from $3k of loan paydown is wiped out by about $12k of value loss. Plan a longer hold.
- Location reads 75/100 on livability (#121 in CA, #4,255 nationally) — a middle-class / working-renter tenant base. Strengths: commute A+, housing A+, amenities B; Watch: crime D+, health & safety D+, cost of living F.
- Hanford Joint Union High (urban): math 20% / reading 58% proficiency, ranked #765 of 1,400 in CA (top 55%) — families likely to look elsewhere, expect single-tenant / working-renter base with shorter leases.
- Watch-outs: built in 1898 — expect roof / HVAC / electrical / plumbing capex.
- Market conditions: Rents rising (+2.9%/yr); 430 active listings in the ZIP; 11 comparable units currently listed for rent nearby; rentals at typical pace (median 14d on market — plan ~3-4 weeks tenant-placement turnaround); solid renter incomes; 741 units permitted in Kings County in 2024 (307 in 5+ unit buildings).
- 5 sale attempts since 6y ago with the ask held roughly flat each time — persistent listings suggest the price (not the market) is what's stuck; bring a comps-based counter.
- Current owner paid $225k; list at $399k implies a 77% gain — meaningful room to come down on a strong offer.
- Climate carrying-cost: extreme-heat days projected 7→17/yr by 2055 (HVAC capex compounding) — expect insurance premiums to compound above CPI over the hold.
- Cap rate 7.8% vs local median 3.9% in Hanford — top-decile yield for the area; either an underpriced asset or a hidden risk that comps aren't pricing in. Stress-test before assuming the spread holds.
- At $3,799/mo this rent would consume 60% of the median local household income ($76k/yr) (locally 2081% of renters already pay >50% of income on rent) — very limited rent-growth headroom before tenants either downsize or default.
Questions for listing agent
- It's been on market 33 days. Have you received any prior offers? Is the seller open to a 5% concession, seller financing, or rate buy-down credit?
- Can we see the unit-by-unit rent roll, current vacancy, and any below-market leases? What's the average tenancy length?
- What capital expenditures (roof, boiler, parking lot, exteriors) have been made in the last 5 years, and what's planned in the next 2?
- Built in 1898 — when were the roof, HVAC, electrical panel, plumbing, and water heater last replaced?
- Is there a deadline driving the sale (1031 exchange, divorce, estate, relocation)? That informs how much negotiation room exists.
- Crime grade is D in this area — have there been break-ins, vandalism, or insurance claims at this property in the last 3 years? What carrier currently insures it and at what premium?
- What's the average days-on-market for RENTAL listings here right now (not sales)? A rising rental-DOM trend means longer vacancies and softer asking-rent achievability than the comps imply.
- What's the recent tenant-quality profile in this submarket — average credit score on applications, eviction rate, late-payment / NSF rate, and stable-employment percentage? A property-management company in the area should have these aggregated.
CashFlowRE · CFR-65CSKM9CS57TT5
· Data 2 days ago
cashflowre.app · 2026-05-29