 Triplex
1320 N Irwin St · Hanford, CA
Flood risk 1/10 · Minimal
- FEMA flood zone
- X (unshaded)
- Chance of flooding over 30 yrs
- 0.0%
- Est. flood insurance / yr
- $507 – $1,088
Fire risk 2/10 · Minimal
- Est. fire insurance / yr
- $659 – $1,223
Heat risk 8/10 · Major
- Hot days now (above 105°F)
- 7 days/yr
- Hot days in 30 yrs
- 17 days/yr
Wind risk 1/10 · Minimal
- Chance of severe wind over 30 yrs
- —
Air-quality risk 10/10 · Severe
- Unhealthy air days now
- 49 days/yr
- Unhealthy air days in 30 yrs
- 50 days/yr
Risk factors via First Street. Map © Google.
Why this score? — see what drove the C- grade
The composite is a weighted blend of 9 inputs, each scored 0–100. Each bar is that input's sub-score; the figure is the points it added to the 100-point composite (weight × sub-score).
- Cash flow +20.3/30.0
- DSCR +6.4/10.0
- ARV discount +6.0/15.0
- 1% rule +4.5/10.0
- Livability +3.8/5.0
- Schools +3.6/10.0
- Rent growth +3.2/5.0
- Condition / age +2.5/5.0
- Appreciation +0.0/10.0
$399,000
🖨 Deal sheet 📄 Offer letter ✓ Due diligence
Multi-family units
County records classify this as Multi-Family (2-4 Unit). Listing-text estimate: 3 units. confirmed
Listing remarks
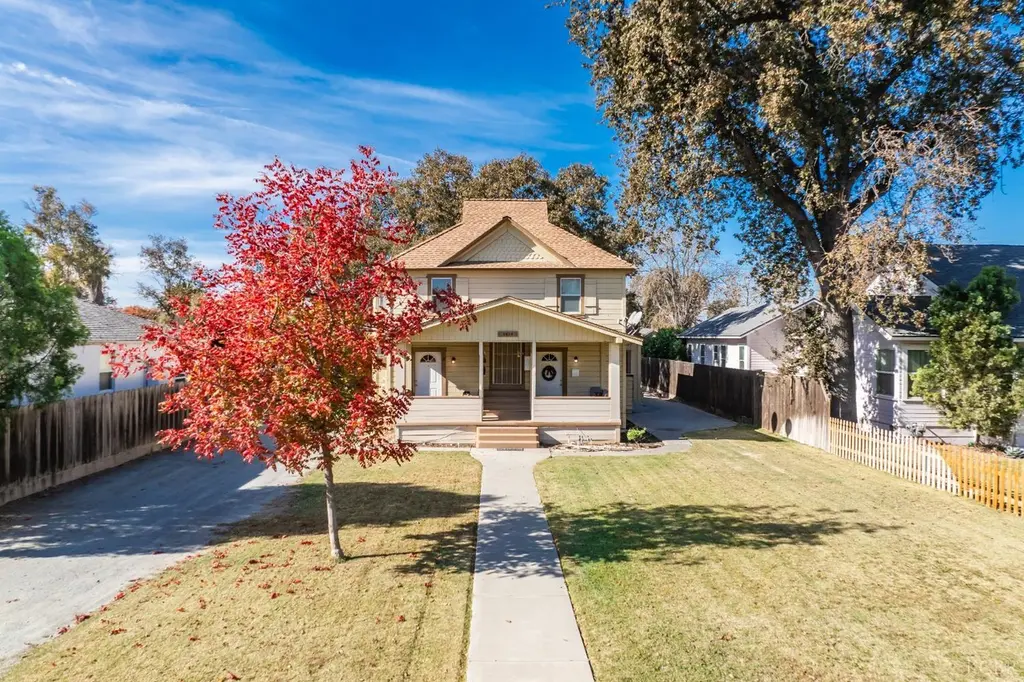
This distinctive Victorian residence has been thoughtfully converted into three occupied rental units, all nested on a generously sized lot in the highly desirable N Irwin neighborhood of Hanford. Each unit offers one bedroom and one bathroom, with the upstairs unit standing out as the largest of three and providing extra living space that enhances its appeal. Every unit showcases its own unique design, reflecting different architectural touches and interior finishes that contribute to a diverse, character-rich rental experience. Each has its own private utility porch equipped with washer & dryer hookups, making daily chores convenient and accessible. Additionally, all three units are
Key facts
- Detached carport
- Generously sized lot
- 0.28 acre lot
Tags
Property features AI
Finance
- Other: Zoned R16
Exterior
- Utilities: Public water; Public sewer
- Home design: Residential multi-family (multiple dwellings); 2 stories
- Construction: Wood siding; Composition roof; Crawl space foundation; Built with wood construction materials
- Exterior features: Porch with screened area; Other exterior features; Front sprinklers; City street frontage
Interior
- Flooring: Carpet; Linoleum
- Bathrooms: 3 full bathrooms
- Heating & cooling: Natural gas heating; Wall/window air conditioning units (multiple)
- Interior features: Other interior features; Gas water heater; Tankless water heater
Neighborhood map
What this means for you Summary
Snapshot
- This is a 3 × 1-bed/1-bath units multifamily listed at $399k.
Deal economics
- At list price, monthly cash flow is $509 ($6k/yr) — positive. Per door: $170/mo.
- The deal already cash-flows at list — no discount required.
- To meet the 1% rule (rent ≥ 1% of price), the offer needs to be $380k (4.8% below list).
- Recommended offer: $380k (4.8% below list) — sets the bar for 1% rule.
- Cap rate 7.8% vs local median 3.9% in Hanford — top-decile yield for the area; either an underpriced asset or a hidden risk that comps aren't pricing in. Stress-test before assuming the spread holds.
Location & tenants
- Location reads 75/100 on livability (#121 in CA, #4,255 nationally) — a middle-class / working-renter tenant base. Strengths: commute A+, housing A+, amenities B; Watch: crime D+, health & safety D+, cost of living F.
- Hanford Joint Union High (urban): math 20% / reading 58% proficiency, ranked #765 of 1,400 in CA (top 55%) — families likely to look elsewhere, expect single-tenant / working-renter base with shorter leases.
- Market conditions: Rents rising (+2.9%/yr); 430 active listings in the ZIP; 11 comparable units currently listed for rent nearby; rentals leasing fast (median 14d on market — plan ~1-2 weeks tenant-placement turnaround); solid renter incomes; 741 units permitted in Kings County in 2024 (307 in 5+ unit buildings).
- At $3,799/mo this rent would consume 60% of the median local household income ($76k/yr) (locally 2081% of renters already pay >50% of income on rent) — very limited rent-growth headroom before tenants either downsize or default.
Forward outlook
- Local home prices are declining (-3.0%/yr); year-one equity from $3k of loan paydown is wiped out by about $12k of value loss. Plan a longer hold.
Negotiation context
- It's been on market 33 days — a 3% lower offer ($387k) is reasonable based on typical stale-listing flexibility.
- 5 sale attempts since 6y ago with the ask held roughly flat each time — persistent listings suggest the price (not the market) is what's stuck; bring a comps-based counter.
- Current owner paid $225k; list at $399k implies a 77% gain — meaningful room to come down on a strong offer.
Risks & watch-outs
- Watch-outs: built in 1898 — expect roof / HVAC / electrical / plumbing capex.
- Climate carrying-cost: extreme-heat days projected 7→17/yr by 2055 (HVAC capex compounding) — expect insurance premiums to compound above CPI over the hold.
Questions for the listing agent
- It's been on market 33 days. Have you received any prior offers? Is the seller open to a 5% concession, seller financing, or rate buy-down credit?
- Can we see the unit-by-unit rent roll, current vacancy, and any below-market leases? What's the average tenancy length?
- What capital expenditures (roof, boiler, parking lot, exteriors) have been made in the last 5 years, and what's planned in the next 2?
- Built in 1898 — when were the roof, HVAC, electrical panel, plumbing, and water heater last replaced?
- Is there a deadline driving the sale (1031 exchange, divorce, estate, relocation)? That informs how much negotiation room exists.
- Crime grade is D in this area — have there been break-ins, vandalism, or insurance claims at this property in the last 3 years? What carrier currently insures it and at what premium?
- What's the average days-on-market for RENTAL listings here right now (not sales)? A rising rental-DOM trend means longer vacancies and softer asking-rent achievability than the comps imply.
- What's the recent tenant-quality profile in this submarket — average credit score on applications, eviction rate, late-payment / NSF rate, and stable-employment percentage? A property-management company in the area should have these aggregated.
- How much new apartment / multifamily construction is in the pipeline within 1–3 miles? Heavy new supply (>2% of stock underway) typically softens rents 12–24 months out; light construction supports rent growth.
Investment metrics
- 1% rule
- 0.95% ✗
- Cap rate
- 7.82%
- Cash-on-cash
- 5.47%
- DSCR
- 1.24
- GRM
- 8.8
CMA / ARV
- ARV (on-the-fly)
- $386,382
- Comps found
- 1
Show comp detail 1 sale within ~0.75 mi
| Address | Dist | Beds/Ba | Sqft | Sold | Price | $/sf | Match |
|---|---|---|---|---|---|---|---|
| 501 E Florinda St E | 0.61mi | 4/2.0 (+1) | 1,600 (-12%) | 5mo | $340,000 | $213 | 39 |
Match score weights: distance 35% · size 25% · config 20% · recency 20%. Top-matched comps best support the ARV.
Projected returns pro-forma
-3.0% appreciation · 2.87% rent growth · sell at horizon
- IRR
- -8.0%
- Equity multiple
- 0.71×
- Total profit
- $-32,819
- Equity at exit
- $59,492
- IRR
- 1.4%
- Equity multiple
- 1.10×
- Total profit
- $10,730
- Equity at exit
- $34,498
Cash invested: $111,720 (down + closing). Projections, not guarantees.
Landlord ↔ Tenant lean methodology
- Overall (STATE)
- 18 Strongly Tenant-Friendly
- State California
- 18 Strongly Tenant-Friendly · D+13
- County
- — inherits STATE
- City
- — inherits STATE
ZIP-level market 93230
- Rents YoY
- 2.9%
- Active inventory
- 430
- Price-to-rent
- 26.3×
Monthly cashflow live
- Estimated rent
- $3,799 high interval (Pro) →
- Mortgage (P&I)
- −$2,092
- Tax from tax record
- −$233 /mo · $2,799/yr
- Insurance
- −$166
- HOA
- −$0
- Vacancy / Maint / Mgmt
- −$798
- Net cashflow
- $509
Break-even live
3-unit breakdown (identical units grouped — click to expand)
| Units | Beds | Baths | Est. rent |
|---|---|---|---|
| 3× units | 1 | 1 | $3,798 |
| #1 | 1 | 1 | $1,266 |
| #2 | 1 | 1 | $1,266 |
| #3 | 1 | 1 | $1,266 |
| Total (3 units) | $3,799 | ||
UW: 25.0% down · 7.5% · 30yr · 1.5% tax · 5.0% vac · 8.0% maint · 8.0% mgmt
Financing live
Cash to close
- Down payment
- $99,750
- Closing costs
- $11,970
- Reserves months
- —
- Total cash needed
- —
Loan-product check · same deal, 3 products live
Conventional
25% down · 7.5% · 30yr
- Down + closing
- —
- Monthly P&I
- —
- Monthly cashflow
- —
- DSCR
- —
- Eligible?
- —
Personal DTI + credit; lowest rate.
DSCR
20% down · 8.5% · 30yr
- Down + closing
- —
- Monthly P&I
- —
- Monthly cashflow
- —
- DSCR
- —
- Eligible?
- —
No personal income docs; deal must DSCR.
Hard money
10% down · 12.0% · 12mo
- Down + closing
- —
- Monthly P&I
- —
- Monthly cashflow
- —
- DSCR
- —
- Eligible?
- —
Short-term bridge; refi at stabilization.
Rent comps 11 comps
| Address | Beds | Baths | Sqft | Rent | $/sqft | DOM | Units | Dist |
|---|---|---|---|---|---|---|---|---|
| 1603 Middleton St Hanford, CA | 3.0 | 3.0 | 2118 | $3,500 | $1.65 | 13d | 1 | 0.25mi |
| 630 Neville St Hanford, CA | 2.0 | 1.0 | 1399 | $1,550 | $1.11 | 21d | 1 | 0.39mi |
| 140 W Terrace Dr Hanford, CA | 2.0 | 2.0 | 1664 | $1,995 | $1.20 | 21d | 1 | 0.48mi |
| 1920 N 11th Ave Hanford, CA | 3.0 | 2.0 | 1500 | $1,650 | $1.10 | 21d | 1 | 0.61mi |
| 1196 Robinson Ct Hanford, CA | 4.0 | 2.5 | 2300 | $2,950 | $1.28 | 21d | 1 | 0.82mi |
| 345 Hanford, CA | 3.0 | 2.0 | 1509 | $2,400 | $1.59 | 13d | 1 | 0.87mi |
| 2103 Beechwood Ct Hanford, CA | 3.0 | 2.0 | 1885 | $2,375 | $1.26 | 13d | 1 | 0.98mi |
| 2144 Beechwood Ct Hanford, CA | 3.0 | 2.0 | 1466 | $1,950 | $1.33 | 13d | 1 | 1.01mi |
| 2337 N 10th Ave Hanford, CA | 3.0 | 2.0 | 1248 | $1,795 | $1.44 | 13d | 1 | 1.21mi |
| 2403 Cherrywood Ct Hanford, CA | 4.0 | 2.0 | 1311 | $2,450 | $1.87 | 13d | 1 | 1.35mi |
| 1373 Van Ct Hanford, CA | 3.0 | 2.0 | 1236 | $1,900 | $1.54 | 21d | 1 | 1.42mi |
Listing history 22 events
-
2026-06-09status $399,000 Pending 33 DOM
-
2026-06-08days on market $399,000 Active 33 DOM
-
2026-06-07days on market $399,000 Active 32 DOM
-
2026-06-05days on market $399,000 Active 29 DOM
-
2026-06-03days on market $399,000 Active 28 DOM
-
2026-06-02days on market $399,000 Active 27 DOM
-
2026-06-01days on market $399,000 Active 26 DOM
-
2026-05-31days on market $399,000 Active 25 DOM
-
2026-05-30days on market $399,000 Active 24 DOM
-
2026-05-06$399,000 Active
-
2025-09-19price $399,900
-
2025-04-03price $405,000
-
2024-10-09price $425,000
-
2024-08-24$450,000 Active
-
2023-11-29$425,000 Active
-
2020-12-31soldstatus $225,000
-
2020-12-31soldstatus $235,000
-
2020-12-31soldstatus $239,900
-
2020-12-31soldstatus $235,000
-
2020-11-09$259,900
-
2020-09-15$259,900
-
1990-05-01soldstatus $65,000
ⓘ Source: listings_history table (triggers on properties + properties_extension) + one-shot
backfill from property_details.listing_events for pre-trigger history.
Tax reassessment forecast CA · Resets to sale price
- Current annual tax
- $2,799 · $233/mo
- Projected year-2 tax
- $3,032 · $253/mo
- Expected delta
- +$233/yr (+$19/mo · 8.3%)
ⓘ Screening estimate from a state-policy table — verify with the county assessor before closing.
Climate risk First Street
- Flood 1/10 Low FEMA zone X (unshaded) · 0% chance over 30 yrs
- Wildfire 2/10 Low
- Heat 8/10 Severe 7 d/yr ≥105°F today · 17 d/yr by 30 yrs out
- Wind 1/10 Low
- Air quality 10/10 Extreme 49 unhealthy d/yr today · 50 by 30 yrs out
Nearby sold comps map
Loading sold comps map…
Walkable amenities ~0.75 mi
Loading nearby amenities…
Taxation est. · year 1
- Rental income
- $45,588
- − Mortgage interest
- −$22,350
- − Property taxes
- −$2,799
- − Insurance
- −$1,995
- − Repairs & maintenance
- −$3,647
- − Management
- −$3,647
- − Depreciation
- −$11,607
- Taxable loss
- −$458
- Est. tax savings @ 24.0%
- +$110
- After-tax cash flow
- $6,222/yr
For passive investors: Depreciation is non-cash, so a rental often shows a tax loss while cash-flowing — sheltering income. Rental losses are passive: they offset passive income freely, and up to $25,000/yr can offset ordinary (W-2) income if you actively participate and your MAGI is under $100k (phasing out to $0 by $150k); unused losses carry forward. On sale, claimed depreciation is recaptured at up to 25%, and gains may owe capital-gains tax (a 1031 exchange can defer both). Figures are a year-1 estimate at your 24.0% rate — not tax advice; consult a CPA.
Schools (NCES district)
- District
- Hanford Joint Union High
- NCES district ID
- 0616500
- Math proficiency
- 20% ▲ 1.00%
- Reading proficiency
- 58% ▬ 0.00%
- Median HH income
- $47,265
- Composite
- 35.8/100
- National rank
- #9626
- State rank
- #765 of 1400 in CA
Livability — Hanford
- Score
- 75/100
- State rank
- #121
- US rank
- #4255
Category grades
Schools grade is shown separately in the Schools card above.
Census & demographics
- Census place
- Hanford, CA
- County
- Kings County · 107,655 people
- City population
- 69,684
- Metro
- Hanford-Corcoran, CA
- Population (ZIP)
- 69,684
- Household income
- $76,023
- Rent vs Own
- Severe rent burden
- 2081.0
Population outlook (Kings County) Hauer SSP2
- Today (2025)
- 147,136 people
- By 2030
- 145,623 · -1.0%
- By 2040
- 146,017 · -0.8%
- By 2050
- 145,239 · -1.3%
- By 2075
- 131,479 · -10.6%
- By 2100
- 103,967 · -29.3%
Race, ethnicity, and origin ACS 2023
- Neighborhood character
- Diverse neighborhood (Simpson 0.60)
- Race & ethnicity
- Hispanic / Latino 52% White 35% Two or more races 19% Black 5% Asian 3% Native American 2%
- Hispanic origin (detail)
- Mexican 49%
- Common ancestry
- Russian 6% Italian 2% Lithuanian 1%
- Foreign-born
- 17% · Canada
- Languages at home
- 65% English-only · Spanish 31% Other Indo-European 2% Tagalog/Filipino 2%
Political lean MEDSL · Kings
- 2024 margin
- Strong R (+23.0) · D 37.4% · R 60.4% · Other 2.2%
- 2008→2024 swing
- -8.9pp toward R · 2008: -14.1pp · 2024: -23.0pp
- All cycles
- 2024: R+23.0 2020: R+12.2 2016: R+14.1 2012: R+16.3 2008: R+14.1
Not yet ingested
- Civics
- —
Market trends
- HPI YoY
- ▼ -267.79%
- Current HPI
- 321.3409
- Rent YoY
- ▲ 2.87%
- Metro
- Hanford-Corcoran, CA
- State GDP YoY
- ▲ 3.21%
- F500 in state
- 116
Industry mix (Fortune 500 HQ in CA)
| Industry | F500 HQs | Revenue |
|---|---|---|
| Technology | 27 | $1,492B |
|
||
| Financial Services | 3 | $174B |
|
||
| Retail | 3 | $44B |
|
||
| Insurance | 3 | $26B |
|
||
| Media / Entertainment | 2 | $115B |
|
||
| Pharmaceuticals / Biotech | 2 | $62B |
|
||
Price history
+513.8% since first listed13 events — show timeline
- 2026-05-06 Listed $399,000 KCBOR
- 2025-09-19 Price Changed $399,900 KCBOR
- 2025-04-03 Price Changed $405,000 KCBOR
- 2024-10-09 Price Changed $425,000 KCBOR
- 2024-08-24 Listed $450,000 KCBOR
- 2023-11-29 Listed $425,000 KCBOR
- 2020-12-31 Sold (Public Records) $235,000 Public Records
- 2020-12-31 Sold (MLS) $239,900 TCMLS
- 2020-12-31 Sold (MLS) $235,000 KCBOR
- 2020-12-31 Sold (MLS) $225,000 FRESNOMLS
- 2020-11-09 Listed $259,900 KCBOR
- 2020-09-15 Listed $259,900 FRESNOMLS
- 1990-05-01 Sold (Public Records) $65,000 Public Records
Property tax history
+8.8%/yrLatest (2025): $2,799 · +3.7% YoY. Source: county tax records.
Cash-flow waterfall
monthlySold comps — $/sqft
last 12 mo · ≤1 miLoading sold comps…