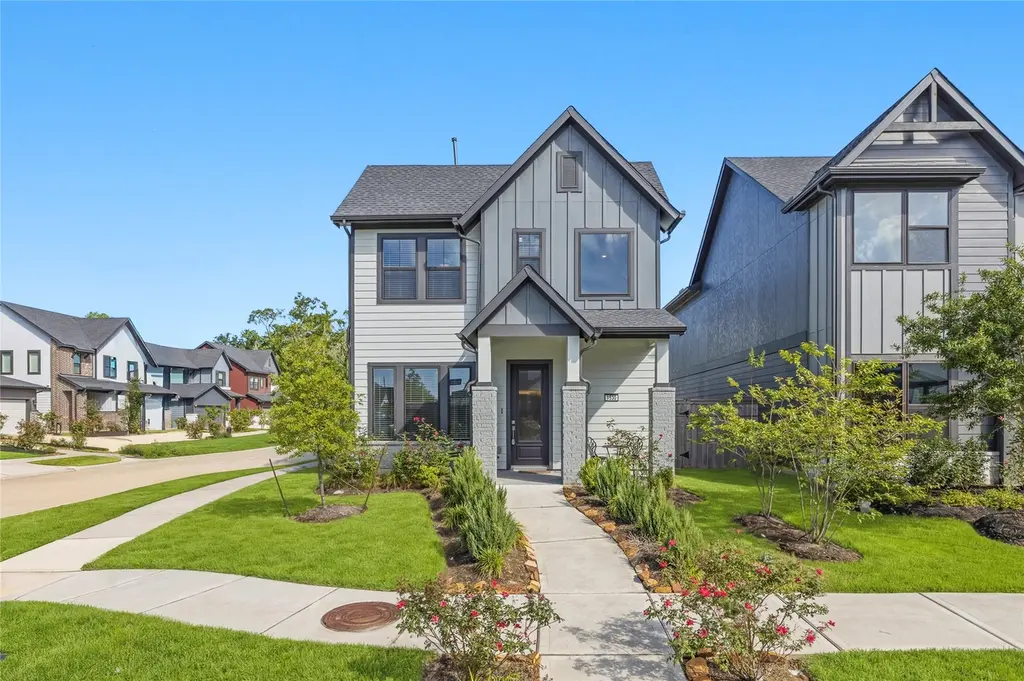
1530 Noble Park Dr
Sienna, TX 77459
$384,900D
3 bd · 2.5 ba ·
1,795 sqft ·
Built 2023
· SingleFamily
· Active
· 63 DOM
Cashflow @ list (25.0% down · 7.5%)
Estimated rent
$3,631/mo
Mortgage (P&I)
−$2,018
Tax + insurance
−$1,050
HOA
−$129
Vac / Maint / Mgmt
−$763
Net cashflow
$-329/mo
Annual
$-3,943/yr
Cap rate
5.48%
Cash-on-cash
-2.92%
DSCR
0.87
1% rule
0.94%
Cash to close
$107,772
Investor read
- This is a 3-bed/2.5-bath single-family listed at $385k. Condition is rated excellent.
- At list price, monthly cash flow is $-329 ($-4k/yr) — negative.
- To cash-flow at today's rent, offer at most $327k (15.1% below list).
- To meet the 1% rule (rent ≥ 1% of price), the offer needs to be $363k (5.7% below list).
- It's been on market 63 days — a 6% lower offer ($362k) is reasonable based on typical stale-listing flexibility.
- Recommended offer: $327k (15.1% below list) — sets the bar for cash-flow.
- Local home prices are declining (-1.7%/yr); year-one equity from $3k of loan paydown is wiped out by about $6k of value loss. Plan a longer hold.
- Location reads: area grade D — affects rentability + tenant quality, not the cash-flow math above.
- Fort Bend ISD (suburban): math 44% / reading 53% proficiency, ranked #140 of 826 in TX (top 17%) — families likely to look elsewhere, expect single-tenant / working-renter base with shorter leases.
- Watch-outs: property tax is 2.6% of price; flood insurance adds $66/mo.
- Market conditions: Rents soft (-0.1%/yr); 1215 active listings in the ZIP; 3 comparable units currently listed for rent nearby; rentals at typical pace (median 23d on market — plan ~3-4 weeks tenant-placement turnaround); high-income renter base; 12,093 units permitted in Fort Bend County in 2024 (815 in 5+ unit buildings).
- Fort Bend County population projected at +75% by 2050 — long-run rental-demand tailwind backs the buy-and-hold thesis.
- 4 sale attempts; this cycle's ask is 13172% above the opening price — seller raised mid-cycle; expect resistance to lowballs.
- Climate carrying-cost: severe flood risk; severe wind risk, 99% chance of damaging wind over 30y; extreme-heat days projected 7→22/yr by 2055 (HVAC capex compounding) — expect insurance premiums to compound above CPI over the hold.
- Cap rate 5.5% vs local median 3.3% in Sienna — top-decile yield for the area; either an underpriced asset or a hidden risk that comps aren't pricing in. Stress-test before assuming the spread holds.
- This rent runs 34% of the median local income ($129k/yr) — at the standard rent-burdened threshold; future hikes will face affordability resistance.
Questions for listing agent
- What do current leases actually rent for vs. the listed asking? Can we see a recent rent roll and the last 12 months of T-12 income?
- It's been on market 63 days. Have you received any prior offers? Is the seller open to a 15% concession, seller financing, or rate buy-down credit?
- Property tax is high relative to price — has the assessment been appealed recently, and will the sale trigger a re-assessment?
- What's the actual annual flood-insurance premium (NFIP or private), and is the property in a SFHA with mandatory coverage?
- What does the HOA fee cover, when was the last increase, and are there any pending special assessments or reserve-fund shortfalls?
- Why hasn't it sold? Are there any deal-killer items the seller is aware of (foundation, flood, title, zoning, code violations)?
- Is there a deadline driving the sale (1031 exchange, divorce, estate, relocation)? That informs how much negotiation room exists.
- The area grade is low — what's the realistic commute time and amenity access for the typical tenant pool here? Any planned neighborhood developments (good or bad) we should know about?
CashFlowRE · CFR-66VB8E9RWAXH3S
· Data 2 days ago
cashflowre.app · 2026-05-29