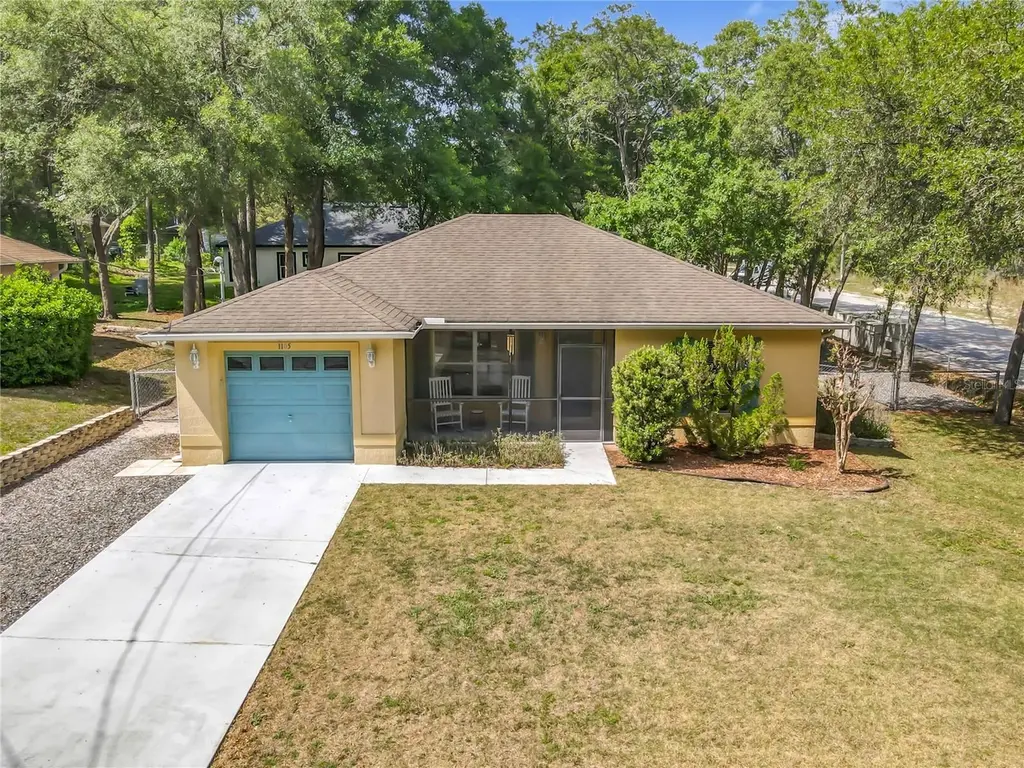
1105 19th St
Orange City, FL 32763
$275,000D
3 bd · 2.0 ba ·
1,205 sqft ·
Built 2006
· SingleFamily
· Pending
· 26 DOM
Cashflow @ list (25.0% down · 7.5%)
Estimated rent
$2,282/mo
Mortgage (P&I)
−$1,442
Tax + insurance
−$421
HOA
−$0
Vac / Maint / Mgmt
−$479
Net cashflow
$-60/mo
Annual
$-719/yr
Cap rate
6.03%
Cash-on-cash
-0.93%
DSCR
0.96
1% rule
0.83%
Cash to close
$77,000
Investor read
- This is a 3-bed/2.0-bath single-family listed at $275k.
- At list price, monthly cash flow is $-60 ($-719/yr) — negative.
- To cash-flow at today's rent, offer at most $264k (3.9% below list).
- To meet the 1% rule (rent ≥ 1% of price), the offer needs to be $228k (17.0% below list).
- It's been on market 26 days — a 2% lower offer ($271k) is reasonable based on typical stale-listing flexibility.
- Recommended offer: $228k (17.0% below list) — sets the bar for 1% rule.
- Local home prices are declining (-3.0%/yr); year-one equity from $2k of loan paydown is wiped out by about $8k of value loss. Plan a longer hold.
- Location reads 71/100 on livability (#406 in FL) — a middle-class / working-renter tenant base. Strengths: cost of living A+, housing A+; Watch: employment D+, amenities F, commute F.
- Volusia (suburban): math 44% / reading 49% proficiency, ranked #47 of 73 in FL (top 64%) — families likely to look elsewhere, expect single-tenant / working-renter base with shorter leases.
- Zoned schools: Orange City Elementary School (math 35% / reading 43%, grade F, #1,560 of 2,144 statewide, top 73%, 615 students, 68% FRL); University High School (math 28% / reading 46%, grade F, #340 of 667 statewide, top 52%, 2,901 students, 49% FRL).
- Market conditions: Rents rising fast (+5.2%/yr); 243 active listings in the ZIP; 2 comparable units currently listed for rent nearby; 3,402 units permitted in Volusia County in 2024 (681 in 5+ unit buildings).
- Volusia County population projected at +19% by 2050 — long-run rental-demand tailwind backs the buy-and-hold thesis.
- Current owner paid $176k; list at $275k implies a 56% gain — meaningful room to come down on a strong offer.
- Climate carrying-cost: severe wind risk, 99% chance of damaging wind over 30y; extreme-heat days projected 7→20/yr by 2055 (HVAC capex compounding) — expect insurance premiums to compound above CPI over the hold.
- This rent runs 41% of the median local income ($67k/yr) — at the standard rent-burdened threshold; future hikes will face affordability resistance.
Questions for listing agent
- What do current leases actually rent for vs. the listed asking? Can we see a recent rent roll and the last 12 months of T-12 income?
- Is there a deadline driving the sale (1031 exchange, divorce, estate, relocation)? That informs how much negotiation room exists.
- The area grade is low — what's the realistic commute time and amenity access for the typical tenant pool here? Any planned neighborhood developments (good or bad) we should know about?
- What's the average days-on-market for RENTAL listings here right now (not sales)? A rising rental-DOM trend means longer vacancies and softer asking-rent achievability than the comps imply.
- What's the recent tenant-quality profile in this submarket — average credit score on applications, eviction rate, late-payment / NSF rate, and stable-employment percentage? A property-management company in the area should have these aggregated.
- How much new for-sale + rental construction is in the pipeline within 1–3 miles? Heavy new supply typically softens prices + rents 12–24 months out; constrained supply supports both.
CashFlowRE · CFR-67Z2EY1PQVYDJS
· Data 3 weeks ago
cashflowre.app · 2026-05-29