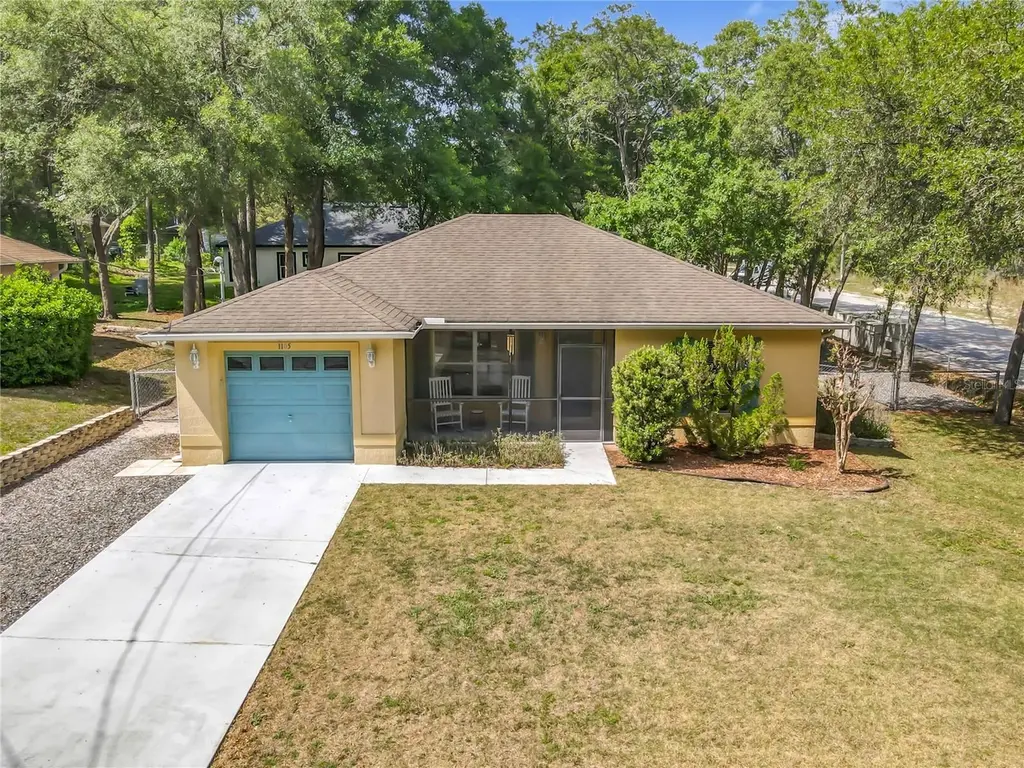
1105 19th St · Orange City, FL
Flood risk 1/10 · Minimal
- FEMA flood zone
- X (unshaded)
- Chance of flooding over 30 yrs
- 0.0%
- Est. flood insurance / yr
- $507 – $1,088
Fire risk 2/10 · Minimal
- Est. fire insurance / yr
- $947 – $1,759
Heat risk 9/10 · Severe
- Hot days now (above 108°F)
- 7 days/yr
- Hot days in 30 yrs
- 20 days/yr
Wind risk 9/10 · Severe
- Chance of severe wind over 30 yrs
- 99.0%
Air-quality risk 2/10 · Minimal
- Unhealthy air days now
- 1 days/yr
- Unhealthy air days in 30 yrs
- 1 days/yr
Risk factors via First Street. Map © Google.
Why this score? — see what drove the D grade
The composite is a weighted blend of 9 inputs, each scored 0–100. Each bar is that input's sub-score; the figure is the points it added to the 100-point composite (weight × sub-score).
- Cash flow +12.1/30.0
- ARV discount +7.5/15.0
- Schools +3.9/10.0
- Rent growth +3.8/5.0
- DSCR +3.6/10.0
- Livability +3.6/5.0
- 1% rule +3.3/10.0
- Condition / age +2.5/5.0
- Appreciation +0.0/10.0
$275,000
🖨 Deal sheet 📄 Offer letter ✓ Due diligence
Listing remarks
New Price. Charming 3 bedroom, 2 bath house with 1205 sq. ft of living space, situated on a desirable corner lot! This well maintained property features a spacious layout with wood laminate and tile floors for easy maintenance & modern living. Enjoy relaxing mornings on the inviting front porch & unwind in the evenings on the back porch overlooking a fully fenced yard ideal for pets, play or entertaining. The house includes a beautifully updated primary bathroom with a brand new shower, adding a fresh stylish touch. All appliances convey, making this move in ready house even more convenient. Equipped with well and septic, you'll enjoy added savings & efficiency. Located in
Key facts
- Tile floors
- Front porch
- Wood laminate floors
Tags
Property features AI
Finance
- Other: Zoning: 01R4; Development: Highland
- Financial info: Lease restrictions apply
- HOA & community: No association (per listing)
Exterior
- Parking: Attached garage (1 car)
- Utilities: Well water; Septic tank; Cable connected; Broadband/high-speed internet available; Electricity connected
- Home design: Single-family residence; One story; South-facing; Property completed
- Construction: Block and stucco construction; Shingle roof; Slab foundation; Built for residential use
- Exterior features: Covered, enclosed and screened front and rear porches; Sliding doors; Chain link fencing; Mature landscaping; Corner lot; Asphalt road (public maintained)
Interior
- Kitchen: Cooktop; Range; Range hood; Microwave; Dishwasher; Refrigerator; Electric water heater
- Bedrooms: 3 bedrooms
- Flooring: Ceramic tile; Laminate
- Bathrooms: 2 full bathrooms
- Heating & cooling: Central heating (electric); Central air conditioning
- Interior features: Ceiling fans; Living room/dining room combo; Solid wood cabinets; Split bedroom layout; Walk-in closets; Window treatments
- Laundry & utility: Laundry room; Washer; Dryer
Neighborhood map
What this means for you Summary
Snapshot
- This is a 3-bed/2.0-bath single-family listed at $275k.
Deal economics
- At list price, monthly cash flow is $-60 ($-719/yr) — negative.
- To cash-flow at today's rent, offer at most $264k (3.9% below list).
- To meet the 1% rule (rent ≥ 1% of price), the offer needs to be $228k (17.0% below list).
- Recommended offer: $228k (17.0% below list) — sets the bar for 1% rule.
Location & tenants
- Location reads 71/100 on livability (#406 in FL) — a middle-class / working-renter tenant base. Strengths: cost of living A+, housing A+; Watch: employment D+, amenities F, commute F.
- Volusia (suburban): math 44% / reading 49% proficiency, ranked #47 of 73 in FL (top 64%) — families likely to look elsewhere, expect single-tenant / working-renter base with shorter leases.
- Zoned schools: Orange City Elementary School (math 35% / reading 43%, grade F, #1,560 of 2,144 statewide, top 73%, 615 students, 68% FRL); University High School (math 28% / reading 46%, grade F, #340 of 667 statewide, top 52%, 2,901 students, 49% FRL).
- Market conditions: Rents rising fast (+5.2%/yr); 243 active listings in the ZIP; 2 comparable units currently listed for rent nearby; 3,402 units permitted in Volusia County in 2024 (681 in 5+ unit buildings).
- This rent runs 41% of the median local income ($67k/yr) — at the standard rent-burdened threshold; future hikes will face affordability resistance.
Forward outlook
- Local home prices are declining (-3.0%/yr); year-one equity from $2k of loan paydown is wiped out by about $8k of value loss. Plan a longer hold.
- Volusia County population projected at +19% by 2050 — long-run rental-demand tailwind backs the buy-and-hold thesis.
Negotiation context
- It's been on market 26 days — a 2% lower offer ($271k) is reasonable based on typical stale-listing flexibility.
- Current owner paid $176k; list at $275k implies a 56% gain — meaningful room to come down on a strong offer.
Risks & watch-outs
- Climate carrying-cost: severe wind risk, 99% chance of damaging wind over 30y; extreme-heat days projected 7→20/yr by 2055 (HVAC capex compounding) — expect insurance premiums to compound above CPI over the hold.
Questions for the listing agent
- What do current leases actually rent for vs. the listed asking? Can we see a recent rent roll and the last 12 months of T-12 income?
- Is there a deadline driving the sale (1031 exchange, divorce, estate, relocation)? That informs how much negotiation room exists.
- The area grade is low — what's the realistic commute time and amenity access for the typical tenant pool here? Any planned neighborhood developments (good or bad) we should know about?
- What's the average days-on-market for RENTAL listings here right now (not sales)? A rising rental-DOM trend means longer vacancies and softer asking-rent achievability than the comps imply.
- What's the recent tenant-quality profile in this submarket — average credit score on applications, eviction rate, late-payment / NSF rate, and stable-employment percentage? A property-management company in the area should have these aggregated.
- How much new for-sale + rental construction is in the pipeline within 1–3 miles? Heavy new supply typically softens prices + rents 12–24 months out; constrained supply supports both.
Investment metrics
- 1% rule
- 0.83% ✗
- Cap rate
- 6.03%
- Cash-on-cash
- -0.93%
- DSCR
- 0.96
- GRM
- 10.0
CMA / ARV
No comps found within radius.
Projected returns pro-forma
-3.0% appreciation · 5.22% rent growth · sell at horizon
- IRR
- -15.4%
- Equity multiple
- 0.44×
- Total profit
- $-43,157
- Equity at exit
- $41,003
- IRR
- -3.6%
- Equity multiple
- 0.74×
- Total profit
- $-20,074
- Equity at exit
- $23,777
Cash invested: $77,000 (down + closing). Projections, not guarantees.
Landlord ↔ Tenant lean methodology
- Overall (STATE)
- 87 Strongly Landlord-Friendly
- State Florida
- 87 Strongly Landlord-Friendly · R+3
- County
- — inherits STATE
- City
- — inherits STATE
ZIP-level market 32763
- Rents YoY
- 5.2%
- Active inventory
- 243
- Price-to-rent
- 10.0×
Monthly cashflow live
- Estimated rent
- $2,282 medium interval (Pro) →
- Mortgage (P&I)
- −$1,442
- Tax from tax record
- −$306 /mo · $3,675/yr
- Insurance
- −$115
- HOA
- −$0
- Vacancy / Maint / Mgmt
- −$479
- Net cashflow
- $-60
Break-even live
UW: 25.0% down · 7.5% · 30yr · 1.5% tax · 5.0% vac · 8.0% maint · 8.0% mgmt
Financing live
Cash to close
- Down payment
- $68,750
- Closing costs
- $8,250
- Reserves months
- —
- Total cash needed
- —
Loan-product check · same deal, 3 products live
Conventional
25% down · 7.5% · 30yr
- Down + closing
- —
- Monthly P&I
- —
- Monthly cashflow
- —
- DSCR
- —
- Eligible?
- —
Personal DTI + credit; lowest rate.
DSCR
20% down · 8.5% · 30yr
- Down + closing
- —
- Monthly P&I
- —
- Monthly cashflow
- —
- DSCR
- —
- Eligible?
- —
No personal income docs; deal must DSCR.
Hard money
10% down · 12.0% · 12mo
- Down + closing
- —
- Monthly P&I
- —
- Monthly cashflow
- —
- DSCR
- —
- Eligible?
- —
Short-term bridge; refi at stabilization.
Rent comps 2 comps
| Address | Beds | Baths | Sqft | Rent | $/sqft | DOM | Units | Dist |
|---|---|---|---|---|---|---|---|---|
| 1490 2nd St Orange City, FL | 3.0 | 2.0 | 1200 | $2,000 | $1.67 | 10d | 1 | 0.97mi |
| 550 E Minnesota Ave Orange City, FL | 2.0 | 1.0 | 900 | $2,850 | $3.17 | 23d | 1 | 1.40mi |
Listing history 3 events
-
2026-05-01$280,000 Active 1060-char remark
-
2006-07-21soldstatus $175,900
-
2005-09-14soldstatus $28,000
ⓘ Source: listings_history table (triggers on properties + properties_extension) + one-shot
backfill from property_details.listing_events for pre-trigger history.
Tax reassessment forecast FL · Resets to sale price
- Current annual tax
- $3,675 · $306/mo
- Projected year-2 tax
- $3,675 · $306/mo
- Expected delta
- $0/yr ($0/mo · 0.0%)
ⓘ Screening estimate from a state-policy table — verify with the county assessor before closing.
Climate risk First Street
- Flood 1/10 Low FEMA zone X (unshaded) · 0% chance over 30 yrs
- Wildfire 2/10 Low
- Heat 9/10 Extreme 7 d/yr ≥108°F today · 20 d/yr by 30 yrs out
- Wind 9/10 Extreme 99% chance of damaging wind over 30 yrs
- Air quality 2/10 Low 1 unhealthy d/yr today · 1 by 30 yrs out
Nearby sold comps map
Loading sold comps map…
Walkable amenities ~0.75 mi
Loading nearby amenities…
Taxation est. · year 1
- Rental income
- $27,387
- − Mortgage interest
- −$15,404
- − Property taxes
- −$3,675
- − Insurance
- −$1,375
- − Repairs & maintenance
- −$2,191
- − Management
- −$2,191
- − Depreciation
- −$8,000
- Taxable loss
- −$5,449
- Est. tax savings @ 24.0%
- +$1,308
- After-tax cash flow
- $588/yr
For passive investors: Depreciation is non-cash, so a rental often shows a tax loss while cash-flowing — sheltering income. Rental losses are passive: they offset passive income freely, and up to $25,000/yr can offset ordinary (W-2) income if you actively participate and your MAGI is under $100k (phasing out to $0 by $150k); unused losses carry forward. On sale, claimed depreciation is recaptured at up to 25%, and gains may owe capital-gains tax (a 1031 exchange can defer both). Figures are a year-1 estimate at your 24.0% rate — not tax advice; consult a CPA.
Schools (NCES district)
- District
- Volusia
- NCES district ID
- 1201920
- Math proficiency
- 44% ▼ -9.00%
- Reading proficiency
- 49% ▼ -3.00%
- Median HH income
- $42,946
- Composite
- 39.2/100
- National rank
- #4019
- State rank
- #47 of 73 in FL
Livability — Orange City
- Score
- 71/100
- State rank
- #406
- US rank
- #7175
Category grades
Schools grade is shown separately in the Schools card above.
Census & demographics
- County
- Volusia County · 556,871 people
- City population
- 24,951
- Metro
- Deltona-Daytona Beach-Ormond Beach, FL
- Population (ZIP)
- 24,951
- Household income
- $66,716
- Rent vs Own
- Severe rent burden
- 1544.0
Population outlook (Volusia County) Hauer SSP2
- Today (2025)
- 572,749 people
- By 2030
- 598,695 · +4.5%
- By 2040
- 644,880 · +12.6%
- By 2050
- 681,451 · +19.0%
- By 2075
- 759,957 · +32.7%
- By 2100
- 778,902 · +36.0%
Race, ethnicity, and origin ACS 2023
- Neighborhood character
- Predominantly White (71%)
- Race & ethnicity
- White 71% Hispanic / Latino 18% Two or more races 7% Black 7% Asian 1%
- Hispanic origin (detail)
- Puerto Rican 12%
- Common ancestry
- Slovak 2% Romanian 2% Lithuanian 2%
- Foreign-born
- 6% · Canada, Vietnam
- Languages at home
- 85% English-only · Spanish 12% Russian/Polish/Slavic 1%
Political lean MEDSL · Volusia
- 2024 margin
- Strong R (+21.8) · D 38.7% · R 60.5%
- 2008→2024 swing
- -27.4pp toward R · 2008: 5.7pp · 2024: -21.8pp
- All cycles
- 2024: R+21.8 2020: R+14.1 2016: R+13.1 2012: R+1.2 2008: D+5.7
Not yet ingested
- Civics
- —
Market trends
- HPI YoY
- ▼ -225.13%
- Current HPI
- 335.8393
- Rent YoY
- ▲ 5.22%
- Metro
- Deltona-Daytona Beach-Ormond Beach, FL
- State GDP YoY
- ▲ 3.28%
- F500 in state
- 36
Industry mix (Fortune 500 HQ in FL)
| Industry | F500 HQs | Revenue |
|---|---|---|
| Industrial Technology | 2 | $29B |
|
||
| Insurance | 2 | $17B |
|
||
| Retail | 1 | $60B |
|
||
| Technology Distribution | 1 | $58B |
|
||
| Homebuilding | 1 | $35B |
|
||
| Technology Manufacturing | 1 | $35B |
|
||
Price history
+882.1% since first listed5 events — show timeline
- 2026-05-27 Pending — Stellar MLS as Distributed by MLS Grid
- 2026-05-25 Price Changed $275,000 Stellar MLS as Distributed by MLS Grid
- 2026-05-01 Listed $280,000 Stellar MLS as Distributed by MLS Grid
- 2006-07-21 Sold (Public Records) $175,900 Public Records
- 2005-09-14 Sold (Public Records) $28,000 Public Records
Property tax history
+7.6%/yrLatest (2025): $3,675 · +3.4% YoY. Source: county tax records.
Cash-flow waterfall
monthlySold comps — $/sqft
last 12 mo · ≤1 miLoading sold comps…