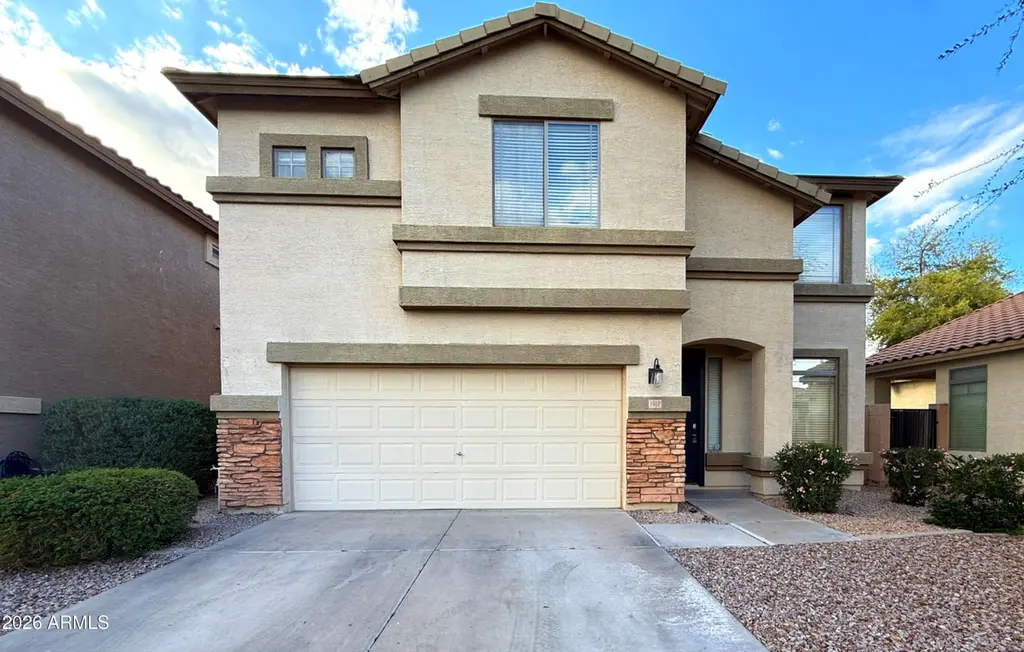
1912 E Hawken Pl
Chandler, AZ 85286
$374,900D-
4 bd · 3.0 ba ·
1,708 sqft ·
Built 2004
· SingleFamily
· Pending
· 55 DOM
Cashflow @ list (25.0% down · 7.5%)
Estimated rent
$2,511/mo
Mortgage (P&I)
−$1,966
Tax + insurance
−$307
HOA
−$187
Vac / Maint / Mgmt
−$527
Net cashflow
$-477/mo
Annual
$-5,723/yr
Cap rate
4.77%
Cash-on-cash
-5.45%
DSCR
0.76
1% rule
0.67%
Cash to close
$104,972
Investor read
- This is a 4-bed/3.0-bath single-family listed at $375k.
- At list price, monthly cash flow is $-477 ($-6k/yr) — negative.
- To cash-flow at today's rent, offer at most $291k (22.5% below list).
- To meet the 1% rule (rent ≥ 1% of price), the offer needs to be $251k (33.0% below list).
- It's been on market 55 days — a 3% lower offer ($364k) is reasonable based on typical stale-listing flexibility.
- Recommended offer: $251k (33.0% below list) — sets the bar for 1% rule.
- Local home prices are declining (-3.0%/yr); year-one equity from $3k of loan paydown is wiped out by about $11k of value loss. Plan a longer hold.
- Location reads 78/100 on livability (#9 in AZ, #2,508 nationally) — a middle-class / working-renter tenant base. Strengths: employment A+, housing A+, crime A-; Watch: health & safety D, cost of living D-.
- Chandler Unified District #80 (4242) (suburban): math 49% / reading 57% proficiency, ranked #31 of 249 in AZ (top 12%) — acceptable for families but not a draw, mixed tenant base, ~2y average lease.
- Market conditions: Rents soft (-0.6%/yr); 169 active listings in the ZIP; 40 comparable units currently listed for rent nearby; rentals at typical pace (median 18d on market — plan ~3-4 weeks tenant-placement turnaround); high-income renter base; 36,011 units permitted in Maricopa County in 2024 (12,801 in 5+ unit buildings).
- Maricopa County population projected at +38% by 2050 — long-run rental-demand tailwind backs the buy-and-hold thesis.
- 9 sale attempts since 22y ago; this cycle's ask has dropped $55k (13%) from the opening price — seller is motivated, your offer sets the floor, not the list.
- Current owner paid $191k; list at $375k implies a 96% gain — meaningful room to come down on a strong offer.
- Climate carrying-cost: extreme-heat days projected 7→19/yr by 2055 (HVAC capex compounding) — expect insurance premiums to compound above CPI over the hold.
- Cap rate 4.8% vs local median 3.3% in Chandler — top-decile yield for the area; either an underpriced asset or a hidden risk that comps aren't pricing in. Stress-test before assuming the spread holds.
Questions for listing agent
- What do current leases actually rent for vs. the listed asking? Can we see a recent rent roll and the last 12 months of T-12 income?
- It's been on market 55 days. Have you received any prior offers? Is the seller open to a 33% concession, seller financing, or rate buy-down credit?
- What does the HOA fee cover, when was the last increase, and are there any pending special assessments or reserve-fund shortfalls?
- Is there a deadline driving the sale (1031 exchange, divorce, estate, relocation)? That informs how much negotiation room exists.
- Schools are B-rated — typically a magnet for longer-tenancy family renters. What's the average tenant stay here, and is there a school-zone premium baked into asking?
- The area grade is low — what's the realistic commute time and amenity access for the typical tenant pool here? Any planned neighborhood developments (good or bad) we should know about?
- What's the average days-on-market for RENTAL listings here right now (not sales)? A rising rental-DOM trend means longer vacancies and softer asking-rent achievability than the comps imply.
- What's the recent tenant-quality profile in this submarket — average credit score on applications, eviction rate, late-payment / NSF rate, and stable-employment percentage? A property-management company in the area should have these aggregated.
CashFlowRE · CFR-68GYXB4KJSFKS5
· Data 3 weeks ago
cashflowre.app · 2026-05-29