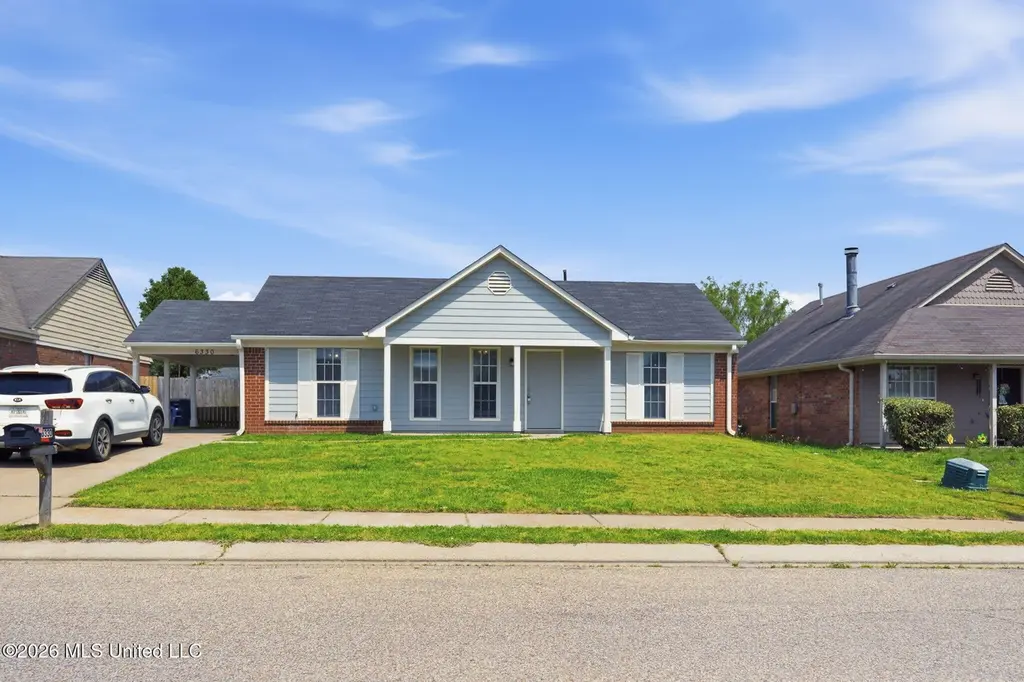
6330 Magnolia Lakes Dr
Olive Branch, MS 38654
$204,900C-
3 bd · 2.0 ba ·
1,092 sqft ·
Built 2000
· SingleFamily
· Pending
· 30 DOM
Cashflow @ list (25.0% down · 7.5%)
Estimated rent
$1,841/mo
Mortgage (P&I)
−$1,075
Tax + insurance
−$230
HOA
−$10
Vac / Maint / Mgmt
−$387
Net cashflow
$140/mo
Annual
$1,683/yr
Cap rate
7.11%
Cash-on-cash
2.93%
DSCR
1.13
1% rule
0.90%
Cash to close
$57,372
Investor read
- This is a 3-bed/2.0-bath single-family listed at $205k.
- At list price, monthly cash flow is $140 ($2k/yr) — positive.
- The deal already cash-flows at list — no discount required.
- To meet the 1% rule (rent ≥ 1% of price), the offer needs to be $184k (10.2% below list).
- It's been on market 30 days — a 2% lower offer ($202k) is reasonable based on typical stale-listing flexibility.
- Recommended offer: $184k (10.2% below list) — sets the bar for 1% rule.
- Local home prices are declining (-3.0%/yr); year-one equity from $1k of loan paydown is wiped out by about $6k of value loss. Plan a longer hold.
- Location reads 72/100 on livability (#29 in MS) — a middle-class / working-renter tenant base. Strengths: cost of living A+, housing A+, employment A; Watch: amenities F, commute F.
- Desoto County School District (suburban): math 48% / reading 42% proficiency, ranked #20 of 130 in MS (top 15%) — families likely to look elsewhere, expect single-tenant / working-renter base with shorter leases.
- Market conditions: Rents soft (-0.3%/yr); 566 active listings in the ZIP; 22 comparable units currently listed for rent nearby; rentals at typical pace (median 24d on market — plan ~3-4 weeks tenant-placement turnaround); 45% of comp listings sitting > 30 days — soft ceiling on asking rent; solid renter incomes; 1,155 units permitted in DeSoto County in 2024 (0 in 5+ unit buildings).
- DeSoto County population projected at +33% by 2050 — long-run rental-demand tailwind backs the buy-and-hold thesis.
- 5 sale attempts since 26y ago with the ask held roughly flat each time — persistent listings suggest the price (not the market) is what's stuck; bring a comps-based counter.
- Climate carrying-cost: extreme-heat days projected 7→21/yr by 2055 (HVAC capex compounding) — expect insurance premiums to compound above CPI over the hold.
- Cap rate 7.1% vs local median 4.3% in Olive Branch — top-decile yield for the area; either an underpriced asset or a hidden risk that comps aren't pricing in. Stress-test before assuming the spread holds.
Questions for listing agent
- What does the HOA fee cover, when was the last increase, and are there any pending special assessments or reserve-fund shortfalls?
- Is there a deadline driving the sale (1031 exchange, divorce, estate, relocation)? That informs how much negotiation room exists.
- Schools are B-rated — typically a magnet for longer-tenancy family renters. What's the average tenant stay here, and is there a school-zone premium baked into asking?
- What's the average days-on-market for RENTAL listings here right now (not sales)? A rising rental-DOM trend means longer vacancies and softer asking-rent achievability than the comps imply.
- What's the recent tenant-quality profile in this submarket — average credit score on applications, eviction rate, late-payment / NSF rate, and stable-employment percentage? A property-management company in the area should have these aggregated.
- How much new for-sale + rental construction is in the pipeline within 1–3 miles? Heavy new supply typically softens prices + rents 12–24 months out; constrained supply supports both.
CashFlowRE · CFR-68KWKXDQPTP0BC
· Data 3 weeks ago
cashflowre.app · 2026-05-29