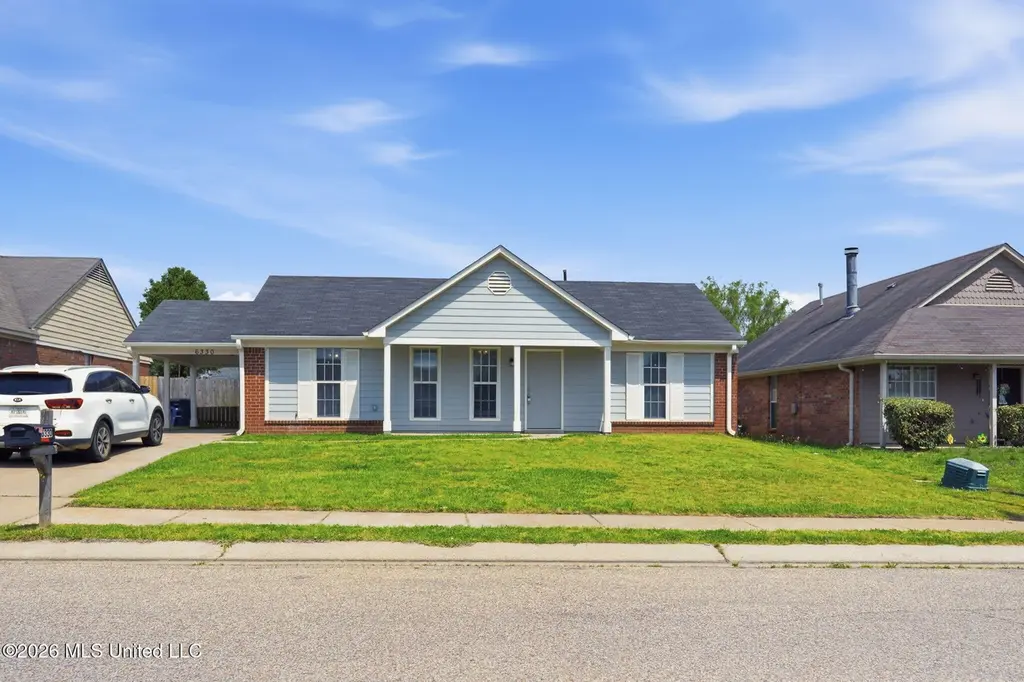
6330 Magnolia Lakes Dr · Olive Branch, MS
Flood risk 1/10 · Minimal
- FEMA flood zone
- X (unshaded)
- Chance of flooding over 30 yrs
- 0.0%
- Est. flood insurance / yr
- $507 – $1,088
Fire risk 4/10 · Minor
- Est. fire insurance / yr
- $1,241 – $2,305
Heat risk 7/10 · Major
- Hot days now (above 109°F)
- 7 days/yr
- Hot days in 30 yrs
- 21 days/yr
Wind risk 4/10 · Minor
- Chance of severe wind over 30 yrs
- 19.0%
Air-quality risk 2/10 · Minimal
- Unhealthy air days now
- 2 days/yr
- Unhealthy air days in 30 yrs
- 2 days/yr
Risk factors via First Street. Map © Google.
Why this score? — see what drove the C- grade
The composite is a weighted blend of 9 inputs, each scored 0–100. Each bar is that input's sub-score; the figure is the points it added to the 100-point composite (weight × sub-score).
- Cash flow +17.0/30.0
- ARV discount +12.7/15.0
- DSCR +5.3/10.0
- 1% rule +4.0/10.0
- Schools +4.0/10.0
- Livability +3.6/5.0
- Condition / age +2.5/5.0
- Rent growth +2.4/5.0
- Appreciation +0.0/10.0
$204,900
🖨 Deal sheet 📄 Offer letter ✓ Due diligence
Listing remarks MLS
One-story home featuring 3 bedrooms, 2 baths, and a carport with a functional and inviting layout. The main living areas offer comfortable space for both everyday living and entertaining, while the kitchen provides ample cabinet and counter space and opens to the dining and living areas for easy flow. Enjoy a private backyard ideal for relaxing or entertaining, with practical features throughout completing this home. One or more photo(s) was virtually staged.
Key facts
- Private backyard
- Ample cabinet space
- Functional layout
Tags
Neighborhood map
What this means for you Summary
Snapshot
- This is a 3-bed/2.0-bath single-family listed at $205k.
Deal economics
- At list price, monthly cash flow is $140 ($2k/yr) — positive.
- The deal already cash-flows at list — no discount required.
- To meet the 1% rule (rent ≥ 1% of price), the offer needs to be $184k (10.2% below list).
- Recommended offer: $184k (10.2% below list) — sets the bar for 1% rule.
- Cap rate 7.1% vs local median 4.3% in Olive Branch — top-decile yield for the area; either an underpriced asset or a hidden risk that comps aren't pricing in. Stress-test before assuming the spread holds.
Location & tenants
- Location reads 72/100 on livability (#29 in MS) — a middle-class / working-renter tenant base. Strengths: cost of living A+, housing A+, employment A; Watch: amenities F, commute F.
- Desoto County School District (suburban): math 48% / reading 42% proficiency, ranked #20 of 130 in MS (top 15%) — families likely to look elsewhere, expect single-tenant / working-renter base with shorter leases.
- Market conditions: Rents soft (-0.3%/yr); 566 active listings in the ZIP; 22 comparable units currently listed for rent nearby; rentals at typical pace (median 24d on market — plan ~3-4 weeks tenant-placement turnaround); 45% of comp listings sitting > 30 days — soft ceiling on asking rent; solid renter incomes; 1,155 units permitted in DeSoto County in 2024 (0 in 5+ unit buildings).
Forward outlook
- Local home prices are declining (-3.0%/yr); year-one equity from $1k of loan paydown is wiped out by about $6k of value loss. Plan a longer hold.
- DeSoto County population projected at +33% by 2050 — long-run rental-demand tailwind backs the buy-and-hold thesis.
Negotiation context
- It's been on market 30 days — a 2% lower offer ($202k) is reasonable based on typical stale-listing flexibility.
- 5 sale attempts since 26y ago with the ask held roughly flat each time — persistent listings suggest the price (not the market) is what's stuck; bring a comps-based counter.
Risks & watch-outs
- Climate carrying-cost: extreme-heat days projected 7→21/yr by 2055 (HVAC capex compounding) — expect insurance premiums to compound above CPI over the hold.
Questions for the listing agent
- What does the HOA fee cover, when was the last increase, and are there any pending special assessments or reserve-fund shortfalls?
- Is there a deadline driving the sale (1031 exchange, divorce, estate, relocation)? That informs how much negotiation room exists.
- Schools are B-rated — typically a magnet for longer-tenancy family renters. What's the average tenant stay here, and is there a school-zone premium baked into asking?
- What's the average days-on-market for RENTAL listings here right now (not sales)? A rising rental-DOM trend means longer vacancies and softer asking-rent achievability than the comps imply.
- What's the recent tenant-quality profile in this submarket — average credit score on applications, eviction rate, late-payment / NSF rate, and stable-employment percentage? A property-management company in the area should have these aggregated.
- How much new for-sale + rental construction is in the pipeline within 1–3 miles? Heavy new supply typically softens prices + rents 12–24 months out; constrained supply supports both.
Investment metrics
- 1% rule
- 0.90% ✗
- Cap rate
- 7.11%
- Cash-on-cash
- 2.93%
- DSCR
- 1.13
- GRM
- 9.3
CMA / ARV
- ARV (median comp)
- $231,682
- List price
- $204,900
- Delta
- -11.56%
- Verdict
- UNDERPRICED
- Comps
- 20 within 1.0 mi
Show comp detail 12 sales within ~0.75 mi
| Address | Dist | Beds/Ba | Sqft | Sold | Price | $/sf | Match |
|---|---|---|---|---|---|---|---|
| 6303 W Oak Run Dr | 0.15mi | 3/2.0 | 1,170 (+7%) | 2mo | $220,000 | $188 | 79 |
| 6338 E Oak Run Dr | 0.07mi | 3/2.0 | 1,104 (+1%) | 19mo | $221,500 | $201 | 79 |
| 6531 Kristen Dr | 0.27mi | 3/2.0 | 1,134 (+4%) | 4mo | $225,000 | $198 | 78 |
| 6604 Grant Cv | 0.28mi | 3/2.0 | 1,148 (+5%) | 10mo | $224,900 | $196 | 70 |
| 5855 Hacks Cross Rd | 0.43mi | 3/2.0 | 1,152 (+6%) | 1mo | $125,000 | $109 | 70 |
| 10415 Oak Leaf Dr | 0.29mi | 3/2.0 | 1,177 (+8%) | 11mo | $219,000 | $186 | 64 |
| 10435 S Kristen Dr | 0.31mi | 3/2.0 | 1,134 (+4%) | 20mo | $209,900 | $185 | 62 |
| 10089 Riggan Dr | 0.68mi | 3/2.0 | 1,114 (+2%) | 14mo | $200,000 | $180 | 53 |
| 10153 Stephenson Ln | 0.73mi | 3/2.0 | 1,200 (+10%) | 2mo | $239,900 | $200 | 48 |
| 10280 Yates Dr | 0.71mi | 3/2.0 | 1,237 (+13%) | 1mo | $210,000 | $170 | 44 |
| 10229 Yates Dr | 0.72mi | 3/2.0 | 1,163 (+6%) | 21mo | $208,570 | $179 | 38 |
| 10230 Yates Dr | 0.74mi | 3/2.0 | 1,166 (+7%) | 20mo | $205,000 | $176 | 38 |
Match score weights: distance 35% · size 25% · config 20% · recency 20%. Top-matched comps best support the ARV.
Projected returns pro-forma
-3.0% appreciation · 0.0% rent growth · sell at horizon
- IRR
- -14.9%
- Equity multiple
- 0.48×
- Total profit
- $-29,698
- Equity at exit
- $30,551
- IRR
- -11.9%
- Equity multiple
- 0.38×
- Total profit
- $-35,347
- Equity at exit
- $17,716
Cash invested: $57,372 (down + closing). Projections, not guarantees.
Landlord ↔ Tenant lean methodology
- Overall (STATE)
- 90 Strongly Landlord-Friendly
- State Mississippi
- 90 Strongly Landlord-Friendly · R+11
- County
- — inherits STATE
- City
- — inherits STATE
ZIP-level market 38654
- Home prices YoY
- -26.1%
- Rents YoY
- -0.3%
- Active inventory
- 566
- Price-to-rent
- 9.3×
Monthly cashflow live
- Estimated rent
- $1,841 high interval (Pro) →
- Mortgage (P&I)
- −$1,075
- Tax from tax record
- −$144 /mo · $1,730/yr
- Insurance
- −$85
- HOA
- −$10
- Vacancy / Maint / Mgmt
- −$387
- Net cashflow
- $140
Break-even live
UW: 25.0% down · 7.5% · 30yr · 1.5% tax · 5.0% vac · 8.0% maint · 8.0% mgmt
Financing live
Cash to close
- Down payment
- $51,225
- Closing costs
- $6,147
- Reserves months
- —
- Total cash needed
- —
Loan-product check · same deal, 3 products live
Conventional
25% down · 7.5% · 30yr
- Down + closing
- —
- Monthly P&I
- —
- Monthly cashflow
- —
- DSCR
- —
- Eligible?
- —
Personal DTI + credit; lowest rate.
DSCR
20% down · 8.5% · 30yr
- Down + closing
- —
- Monthly P&I
- —
- Monthly cashflow
- —
- DSCR
- —
- Eligible?
- —
No personal income docs; deal must DSCR.
Hard money
10% down · 12.0% · 12mo
- Down + closing
- —
- Monthly P&I
- —
- Monthly cashflow
- —
- DSCR
- —
- Eligible?
- —
Short-term bridge; refi at stabilization.
Rent comps 22 comps
| Address | Beds | Baths | Sqft | Rent | $/sqft | DOM | Units | Dist |
|---|---|---|---|---|---|---|---|---|
| 10515 Oak Leaf Dr Olive Branch, MS | 3.0 | 2.0 | 1162 | $1,595 | $1.37 | 43d | 1 | 0.14mi |
| 6213 Magnolia Lakes Dr Olive Branch, MS | 3.0 | 2.0 | 1134 | $1,675 | $1.48 | 43d | 1 | 0.15mi |
| 10453 Kristen Dr S Olive Branch, MS | 3.0 | 2.0 | 1264 | $1,803 | $1.43 | 3d | 1 | 0.33mi |
| 5746 Oakley Dr Olive Branch, MS | 3.0 | 2.0 | 1358 | $1,835 | $1.35 | 4d | 1 | 0.44mi |
| 10257 Palmer Dr Olive Branch, MS | 3.0 | 2.0 | 1134 | $1,495 | $1.32 | 23d | 1 | 0.51mi |
| 6649 Magnolia Dr Olive Branch, MS | 3.0 | 2.0 | 1085 | $1,800 | $1.66 | 43d | 1 | 0.58mi |
| 10233 Curtis Dr Olive Branch, MS | 3.0 | 2.0 | 1157 | $1,595 | $1.38 | 43d | 1 | 0.59mi |
| 10378 Yates Dr Olive Branch, MS | 3.0 | 2.0 | 1324 | $1,780 | $1.34 | 4d | 1 | 0.64mi |
| 6571 Ashland Dr Olive Branch, MS | 3.0 | 2.0 | 1276 | $1,723 | $1.35 | 20d | 1 | 0.73mi |
| 6534 Valerie Dr Olive Branch, MS | 4.0 | 2.0 | 1500 | $1,923 | $1.28 | 43d | 1 | 0.75mi |
| 9931 Adina Cv Olive Branch, MS | 3.0 | 2.0 | 1258 | $1,723 | $1.37 | 23d | 1 | 0.78mi |
| 6178 Morgan Manor Dr E Olive Branch, MS | 3.0 | 2.0 | 1411 | $1,860 | $1.32 | 11d | 1 | 0.79mi |
| 6763 Ashland Dr Olive Branch, MS | 3.0 | 2.0 | 1200 | $1,590 | $1.32 | 11d | 1 | 0.85mi |
| 7104 Olive Ridge Dr Olive Branch, MS | 3.0 | 2.0 | 1242 | $1,895 | $1.53 | 43d | 1 | 0.91mi |
| 7117 Goodman Ridge Dr Olive Branch, MS | 3.0 | 2.0 | 1411 | $1,755 | $1.24 | 14d | 1 | 0.92mi |
| 6801 College Park Cv Olive Branch, MS | 3.0 | 2.0 | 1160 | $1,660 | $1.43 | 43d | 1 | 0.93mi |
| 6866 Valerie Dr Olive Branch, MS | 3.0 | 2.0 | 1500 | $1,795 | $1.20 | 43d | 1 | 0.96mi |
| 6813 Maury Dr Olive Branch, MS | 3.0 | 2.0 | 1086 | $1,395 | $1.28 | 43d | 1 | 1.01mi |
| 9763 Riggan Dr Olive Branch, MS | 3.0 | 2.0 | 1224 | $1,695 | $1.38 | 20d | 1 | 1.03mi |
| 6795 Blocker St Unit 10 Olive Branch, MS | 2.0 | 1.0 | 750 | $1,095 | $1.46 | 43d | 1 | 1.39mi |
| 6795 Blocker St Olive Branch, MS | 2.0 | 1.0 | 750 | $1,095 | $1.46 | 23d | 1 | 1.39mi |
| 9455 Goodman Rd Unit b 3 Olive Branch, MS | 2.0 | 1.0 | 850 | $1,250 | $1.47 | 23d | 1 | 1.44mi |
HOA detail
- Monthly dues
- $10 · $120/yr
Listing history 12 events
-
2026-05-06status Active 463-char remark
Show marketing remark (463 chars)
One-story home featuring 3 bedrooms, 2 baths, and a carport with a functional and inviting layout. The main living areas offer comfortable space for both everyday living and entertaining, while the kitchen provides ample cabinet and counter space and opens to the dining and living areas for easy flow. Enjoy a private backyard ideal for relaxing or entertaining, with practical features throughout completing this home. One or more photo(s) was virtually staged.
-
2026-04-21status Pending 463-char remark
Show marketing remark (463 chars)
One-story home featuring 3 bedrooms, 2 baths, and a carport with a functional and inviting layout. The main living areas offer comfortable space for both everyday living and entertaining, while the kitchen provides ample cabinet and counter space and opens to the dining and living areas for easy flow. Enjoy a private backyard ideal for relaxing or entertaining, with practical features throughout completing this home. One or more photo(s) was virtually staged.
-
2026-04-13$209,900 Active 463-char remark
Show marketing remark (463 chars)
One-story home featuring 3 bedrooms, 2 baths, and a carport with a functional and inviting layout. The main living areas offer comfortable space for both everyday living and entertaining, while the kitchen provides ample cabinet and counter space and opens to the dining and living areas for easy flow. Enjoy a private backyard ideal for relaxing or entertaining, with practical features throughout completing this home. One or more photo(s) was virtually staged.
-
2026-02-27historical $1,788
-
2026-02-18$1,788
-
2021-11-17soldstatus
-
2004-07-29soldstatus
-
2004-07-27soldstatus 391-char remark
Show marketing remark (391 chars)
Great for lst time homeowners. Nice family community with lake and park, close to Desoto County schools, shopping, minutes from Memphis. Great 3 bd, 2 ba, split bedroom floor plan. Huge fenced back yard, with storage bldg, great for kids. Items to remain are miniblinds, refrigerator, and 10 x 12 storage bldg, Window treatments to be removed are 2nd & 3rd bedroom; all others to remain.
-
2004-03-11$93,500 391-char remark
Show marketing remark (391 chars)
Great for lst time homeowners. Nice family community with lake and park, close to Desoto County schools, shopping, minutes from Memphis. Great 3 bd, 2 ba, split bedroom floor plan. Huge fenced back yard, with storage bldg, great for kids. Items to remain are miniblinds, refrigerator, and 10 x 12 storage bldg, Window treatments to be removed are 2nd & 3rd bedroom; all others to remain.
-
2000-10-24soldstatus
-
2000-10-19$84,950
-
2000-10-18soldstatus
ⓘ Source: listings_history table (triggers on properties + properties_extension) + one-shot
backfill from property_details.listing_events for pre-trigger history.
Tax reassessment forecast MS · Resets to sale price
- Current annual tax
- $1,730 · $144/mo
- Projected year-2 tax
- $1,730 · $144/mo
- Expected delta
- $0/yr ($0/mo · 0.0%)
ⓘ Screening estimate from a state-policy table — verify with the county assessor before closing.
Climate risk First Street
- Flood 1/10 Low FEMA zone X (unshaded) · 0% chance over 30 yrs
- Wildfire 4/10 Moderate
- Heat 7/10 Severe 7 d/yr ≥109°F today · 21 d/yr by 30 yrs out
- Wind 4/10 Moderate 19% chance of damaging wind over 30 yrs
- Air quality 2/10 Low 2 unhealthy d/yr today · 2 by 30 yrs out
Nearby sold comps map
Loading sold comps map…
Walkable amenities ~0.75 mi
Loading nearby amenities…
Taxation est. · year 1
- Rental income
- $22,092
- − Mortgage interest
- −$11,478
- − Property taxes
- −$1,730
- − Insurance
- −$1,024
- − Repairs & maintenance
- −$1,767
- − Management
- −$1,767
- − HOA
- −$120
- − Depreciation
- −$5,961
- Taxable loss
- −$1,756
- Est. tax savings @ 24.0%
- +$421
- After-tax cash flow
- $2,105/yr
For passive investors: Depreciation is non-cash, so a rental often shows a tax loss while cash-flowing — sheltering income. Rental losses are passive: they offset passive income freely, and up to $25,000/yr can offset ordinary (W-2) income if you actively participate and your MAGI is under $100k (phasing out to $0 by $150k); unused losses carry forward. On sale, claimed depreciation is recaptured at up to 25%, and gains may owe capital-gains tax (a 1031 exchange can defer both). Figures are a year-1 estimate at your 24.0% rate — not tax advice; consult a CPA.
Schools (NCES district)
- District
- Desoto County School District
- NCES district ID
- 2801320
- Math proficiency
- 48% ▼ -13.00%
- Reading proficiency
- 42% ▼ -6.00%
- Median HH income
- $59,272
- Composite
- 39.56/100
- National rank
- #3933
- State rank
- #20 of 130 in MS
Livability — Olive Branch
- Score
- 72/100
- State rank
- #29
- US rank
- #6509
Category grades
Schools grade is shown separately in the Schools card above.
Census & demographics
- Census place
- Olive Branch, MS
- County
- DeSoto County · 176,513 people
- City population
- 57,898
- Metro
- Memphis, TN-MS-AR
- Population (ZIP)
- 57,898
- Household income
- $103,092
- Rent vs Own
- Severe rent burden
- 801.0
Population outlook (DeSoto County) Hauer SSP2
- Today (2025)
- 203,338 people
- By 2030
- 217,692 · +7.1%
- By 2040
- 245,320 · +20.6%
- By 2050
- 270,133 · +32.8%
- By 2075
- 323,341 · +59.0%
- By 2100
- 348,742 · +71.5%
Race, ethnicity, and origin ACS 2023
- Neighborhood character
- Diverse neighborhood (Simpson 0.57)
- Race & ethnicity
- White 57% Black 32% Hispanic / Latino 5% Two or more races 5% Asian 2%
- Hispanic origin (detail)
- Mexican 4%
- Common ancestry
- Slovak 2% Lithuanian 1% Romanian 1%
- Foreign-born
- 4% · Canada, Vietnam, China
- Languages at home
- 93% English-only · Spanish 4% Vietnamese 1% Arabic 1%
Political lean MEDSL · DeSoto
- 2024 margin
- Strong R (+24.1) · D 36.7% · R 60.8% · Other 2.5%
- 2008→2024 swing
- +14.2pp toward D · 2008: -38.2pp · 2024: -24.1pp
- All cycles
- 2024: R+24.1 2020: R+23.9 2016: R+34.8 2012: R+33.5 2008: R+38.2
Not yet ingested
- Civics
- —
Market trends
- HPI YoY
- ▼ -66.27%
- Current HPI
- 187.2114
- Rent YoY
- ▼ -0.34%
- Metro
- Memphis, TN-MS-AR
- State GDP YoY
- —
- F500 in state
- 0
Price history
+147.1% since first listed12 events — show timeline
- 2026-05-06 Relisted — MLSU
- 2026-04-21 Pending — MLSU
- 2026-04-13 Listed $209,900 MLSU
- 2026-02-27 Rental Removed $1,788 RENTLY
- 2026-02-18 Listed for Rent $1,788 RENTLY
- 2021-11-17 Sold (Public Records) — Public Records
- 2004-07-29 Sold (Public Records) — Public Records
- 2004-07-27 Sold (MLS) — MLSU
- 2004-03-11 Listed $93,500 MLSU
- 2000-10-24 Sold (Public Records) — Public Records
- 2000-10-19 Listed $84,950 MLSU
- 2000-10-18 Sold (MLS) — MLSU
Property tax history
+1.6%/yrLatest (2025): $1,730 · +12.8% YoY. Source: county tax records.
Cash-flow waterfall
monthlySold comps — $/sqft
last 12 mo · ≤1 miLoading sold comps…