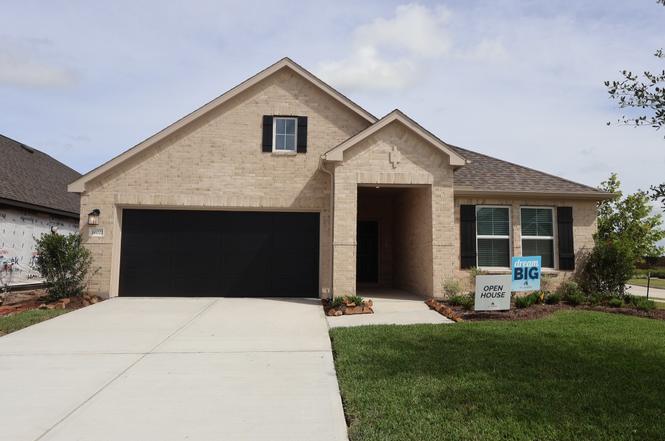
14021 Baikal Manor Dr
Texas City, TX 77510
$359,990D
4 bd · 3.0 ba ·
2,196 sqft ·
Built 2026
· Land
· Active
· 2 DOM
Cashflow @ list (25.0% down · 7.5%)
Estimated rent
$3,183/mo
Mortgage (P&I)
−$1,888
Tax + insurance
−$271
HOA
−$133
Vac / Maint / Mgmt
−$668
Net cashflow
$222/mo
Annual
$2,669/yr
Cap rate
7.03%
Cash-on-cash
2.65%
DSCR
1.12
1% rule
0.88%
Cash to close
$100,797
Investor read
- This is a 4-bed/3.0-bath land listed at $360k.
- At list price, monthly cash flow is $222 ($3k/yr) — positive.
- The deal already cash-flows at list — no discount required.
- To meet the 1% rule (rent ≥ 1% of price), the offer needs to be $318k (11.6% below list).
- Only 2 days on market — expect competitive offers; lowballing is unlikely to land.
- Recommended offer: $318k (11.6% below list) — sets the bar for 1% rule.
- Local home prices are declining (-3.0%/yr); year-one equity from $2k of loan paydown is wiped out by about $11k of value loss. Plan a longer hold.
- Location reads 62/100 on livability (#907 in TX) — a middle-class / working-renter tenant base. Strengths: cost of living A+, housing A+; Watch: crime D+, amenities F, commute F.
- Dickinson ISD (suburban): math 39% / reading 40% proficiency, ranked #366 of 826 in TX (top 44%) — families likely to look elsewhere, expect single-tenant / working-renter base with shorter leases; 60% free/reduced lunch — lower-income household profile, screen leases tightly.
- Zoned schools: Elva C Lobit Middle (math 31% / reading 27%, grade F, #1,103 of 1,662 statewide, top 67%, 582 students, 52% FRL); Dickinson H S (math 30% / reading 46%, grade F, #880 of 1,632 statewide, top 54%, 3,619 students, 64% FRL) — zoned schools at 58% FRL track the district average.
- Market conditions: 233 active listings in the ZIP; 4 comparable units currently listed for rent nearby; rentals at typical pace (median 22d on market — plan ~3-4 weeks tenant-placement turnaround); 3,258 units permitted in Galveston County in 2024 (0 in 5+ unit buildings).
- Galveston County population projected at +43% by 2050 — long-run rental-demand tailwind backs the buy-and-hold thesis.
- Cap rate 7.0% vs local median 4.3% in Texas City — top-decile yield for the area; either an underpriced asset or a hidden risk that comps aren't pricing in. Stress-test before assuming the spread holds.
Questions for listing agent
- What does the HOA fee cover, when was the last increase, and are there any pending special assessments or reserve-fund shortfalls?
- Is there a deadline driving the sale (1031 exchange, divorce, estate, relocation)? That informs how much negotiation room exists.
- Schools are F-rated, which usually means shorter tenancies and higher turnover. Who's the typical renter profile here, and what's been the actual vacancy rate?
- Crime grade is D in this area — have there been break-ins, vandalism, or insurance claims at this property in the last 3 years? What carrier currently insures it and at what premium?
- The area grade is low — what's the realistic commute time and amenity access for the typical tenant pool here? Any planned neighborhood developments (good or bad) we should know about?
- What's the average days-on-market for RENTAL listings here right now (not sales)? A rising rental-DOM trend means longer vacancies and softer asking-rent achievability than the comps imply.
- What's the recent tenant-quality profile in this submarket — average credit score on applications, eviction rate, late-payment / NSF rate, and stable-employment percentage? A property-management company in the area should have these aggregated.
- How much new for-sale + rental construction is in the pipeline within 1–3 miles? Heavy new supply typically softens prices + rents 12–24 months out; constrained supply supports both.
CashFlowRE · CFR-68TAC9DM94QQ56
· Data 2 days ago
cashflowre.app · 2026-05-29