None
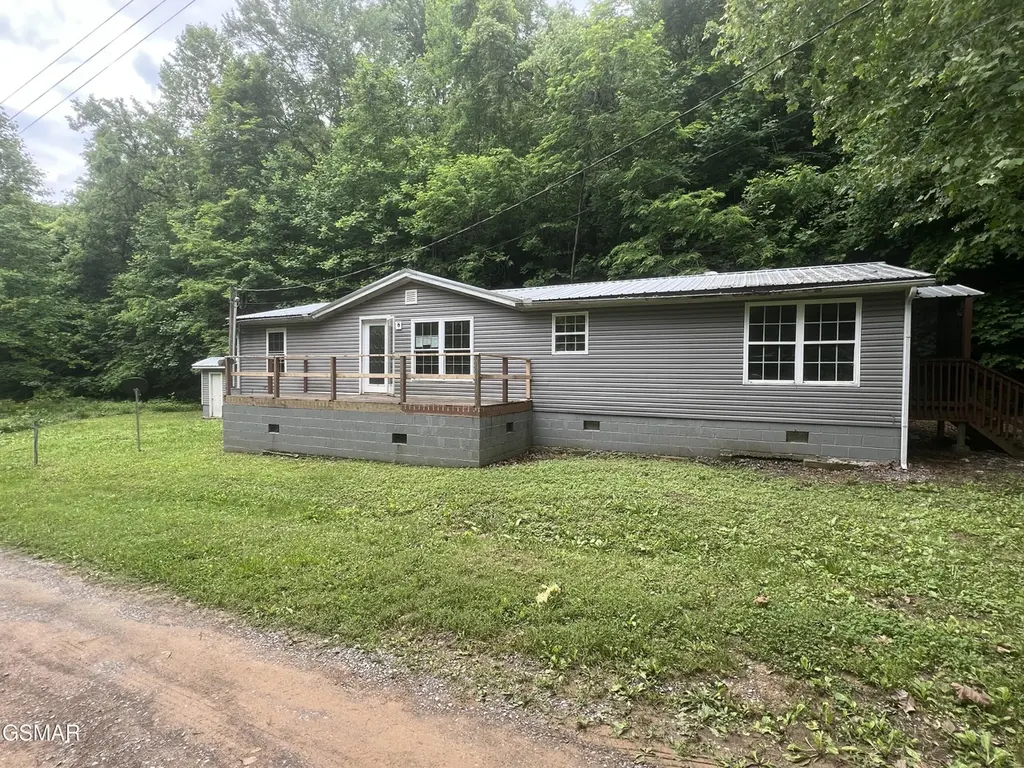
Fairgarden, TN 37876
$230,000C-
3 bd · 2.0 ba ·
1,400 sqft ·
Built 1996
· Manufactured
· Active
· 16 DOM
Cashflow @ list (25.0% down · 7.5%)
Estimated rent
$2,065/mo
Mortgage (P&I)
−$1,206
Tax + insurance
−$383
HOA
−$0
Vac / Maint / Mgmt
−$434
Net cashflow
$42/mo
Annual
$500/yr
Cap rate
6.51%
Cash-on-cash
0.78%
DSCR
1.03
1% rule
0.90%
Cash to close
$64,400
Investor read
- This is a 3-bed/2.0-bath manufactured listed at $230k.
- At list price, monthly cash flow is $42 ($500/yr) — positive.
- The deal already cash-flows at list — no discount required.
- To meet the 1% rule (rent ≥ 1% of price), the offer needs to be $206k (10.2% below list).
- It's been on market 16 days — a 2% lower offer ($227k) is reasonable based on typical stale-listing flexibility.
- Recommended offer: $206k (10.2% below list) — sets the bar for 1% rule.
- In year one you build about $25k of equity ($2k loan paydown + $23k appreciation (10.0% local appreciation)).
- Location reads 54/100 on livability (#381 in TN) — a working-class tenant base; expect higher turnover. Strengths: cost of living A+, housing A-; Watch: schools F, crime F, amenities F.
- Sevier County (rural): math 31% / reading 28% proficiency, ranked #62 of 139 in TN (top 45%) — low school quality limits family demand, transient renter base, plan for 1-2y turnover.
- Market conditions: Rents soft (-2.6%/yr); 1127 active listings in the ZIP; 1 comparable units currently listed for rent nearby; 1,594 units permitted in Sevier County in 2024 (456 in 5+ unit buildings).
- Sevier County population projected at +22% by 2050 — long-run rental-demand tailwind backs the buy-and-hold thesis.
- 10 sale attempts since 5y ago with the ask held roughly flat each time — persistent listings suggest the price (not the market) is what's stuck; bring a comps-based counter.
- At projected returns (10.0% appreciation + 0.0% rent growth), your $64k cash investment doubles in ~3 years — after that, you're playing with house money.
- By year 2, paydown + projected appreciation supports a ~$40k cash-out refi (75% LTV) — recoverable capital for the next deal without selling this one.
- Cap rate 6.5% vs local median 1.9% in Fairgarden — top-decile yield for the area; either an underpriced asset or a hidden risk that comps aren't pricing in. Stress-test before assuming the spread holds.
- This rent runs 43% of the median local income ($58k/yr) — at the standard rent-burdened threshold; future hikes will face affordability resistance.
Questions for listing agent
- Is there a deadline driving the sale (1031 exchange, divorce, estate, relocation)? That informs how much negotiation room exists.
- Schools are F-rated, which usually means shorter tenancies and higher turnover. Who's the typical renter profile here, and what's been the actual vacancy rate?
- Crime grade is F in this area — have there been break-ins, vandalism, or insurance claims at this property in the last 3 years? What carrier currently insures it and at what premium?
- What's the average days-on-market for RENTAL listings here right now (not sales)? A rising rental-DOM trend means longer vacancies and softer asking-rent achievability than the comps imply.
- What's the recent tenant-quality profile in this submarket — average credit score on applications, eviction rate, late-payment / NSF rate, and stable-employment percentage? A property-management company in the area should have these aggregated.
- How much new for-sale + rental construction is in the pipeline within 1–3 miles? Heavy new supply typically softens prices + rents 12–24 months out; constrained supply supports both.
CashFlowRE · CFR-6B3TYEE1G5TTQF
· Data 1 day ago
cashflowre.app · 2026-05-29