None · Fairgarden, TN
Flood risk No data
- FEMA flood zone
- —
- Chance of flooding over 30 yrs
- —
- Est. flood insurance / yr
- —
Fire risk No data
- Est. fire insurance / yr
- —
Heat risk No data
- Hot days now (above threshold)
- —
- Hot days in 30 yrs
- —
Wind risk No data
- Chance of severe wind over 30 yrs
- —
Air-quality risk No data
- Unhealthy air days now
- —
- Unhealthy air days in 30 yrs
- —
Risk factors via First Street. Map © Google.
Why this score? — see what drove the C- grade
The composite is a weighted blend of 9 inputs, each scored 0–100. Each bar is that input's sub-score; the figure is the points it added to the 100-point composite (weight × sub-score).
- Cash flow +14.3/30.0
- ARV discount +12.8/15.0
- Appreciation +10.0/10.0
- DSCR +4.3/10.0
- 1% rule +4.0/10.0
- Livability +2.7/5.0
- Schools +2.5/10.0
- Condition / age +2.5/5.0
- Rent growth +1.9/5.0
$230,000
🖨 Deal sheet 📄 Offer letter ✓ Due diligence
Listing remarks MLS
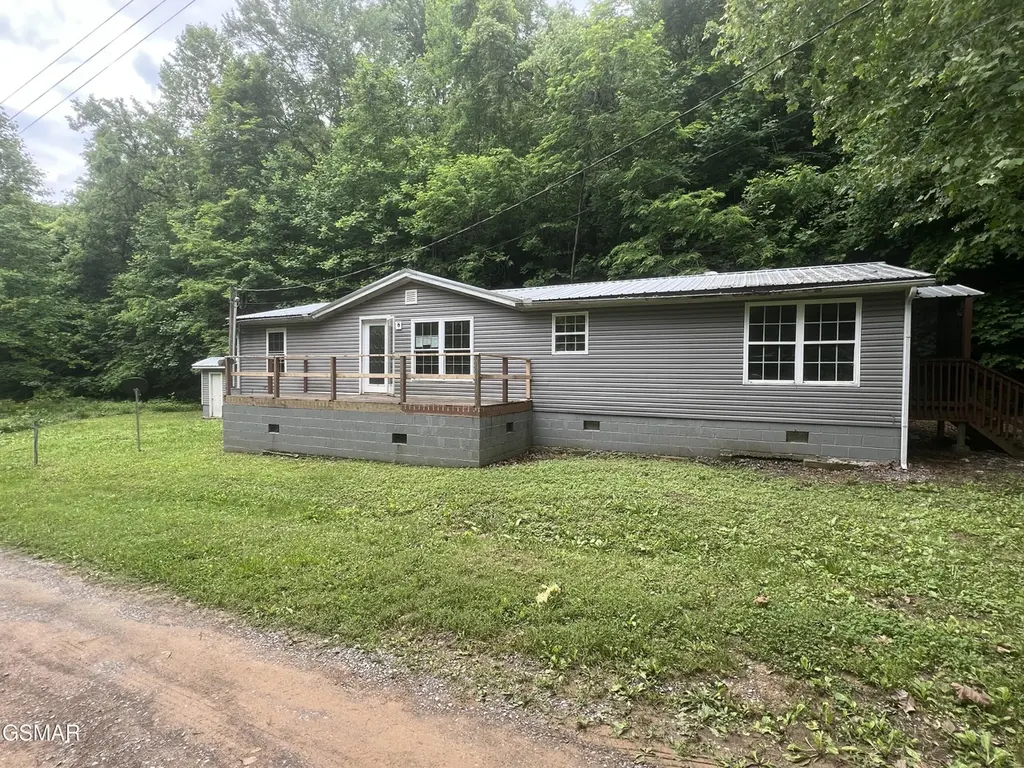
This mobile has been totally remodeled with stick build materials. All new floors, Sheetrock walls, New Tin Roof, New A/C, Water Heater, New Water lines, cabinets, New Carpets, Laminate Floors and on block foundation. Plus 5.5 acres.
Key facts
- Private acres
- Mountain setting
- Desirable location
Tags
Property features AI
Finance
- Other: Lot size approximately 4.53 acres; Zoning: R-1
Exterior
- Parking: Off-street parking
- Security: Smoke detectors
- Utilities: Private water source; Septic tank; Electricity available
- Home design: Single-family residence; One story
- Construction: Metal roof; Other construction materials; Block skirting (mobile home)
- Exterior features: Porch; Gravel road access; Publicly maintained road; Pets allowed
Interior
- Kitchen: Dishwasher; Electric range; Microwave; Electric water heater
- Bedrooms: 5 total rooms
- Flooring: Laminate
- Bathrooms: 2 full bathrooms
- Heating & cooling: Central heating; Central air conditioning
- Interior features: Breakfast bar; Ceiling fans; Eat-in kitchen
- Laundry & utility: Washer hookup; Electric dryer hookup
Neighborhood map
What this means for you Summary
Snapshot
- This is a 3-bed/2.0-bath manufactured listed at $230k.
Deal economics
- At list price, monthly cash flow is $42 ($500/yr) — positive.
- The deal already cash-flows at list — no discount required.
- To meet the 1% rule (rent ≥ 1% of price), the offer needs to be $206k (10.2% below list).
- Recommended offer: $206k (10.2% below list) — sets the bar for 1% rule.
- Cap rate 6.5% vs local median 1.9% in Fairgarden — top-decile yield for the area; either an underpriced asset or a hidden risk that comps aren't pricing in. Stress-test before assuming the spread holds.
Location & tenants
- Location reads 54/100 on livability (#381 in TN) — a working-class tenant base; expect higher turnover. Strengths: cost of living A+, housing A-; Watch: schools F, crime F, amenities F.
- Sevier County (rural): math 31% / reading 28% proficiency, ranked #62 of 139 in TN (top 45%) — low school quality limits family demand, transient renter base, plan for 1-2y turnover.
- Market conditions: Rents soft (-2.6%/yr); 1127 active listings in the ZIP; 1 comparable units currently listed for rent nearby; 1,594 units permitted in Sevier County in 2024 (456 in 5+ unit buildings).
- This rent runs 43% of the median local income ($58k/yr) — at the standard rent-burdened threshold; future hikes will face affordability resistance.
Forward outlook
- In year one you build about $25k of equity ($2k loan paydown + $23k appreciation (10.0% local appreciation)).
- Sevier County population projected at +22% by 2050 — long-run rental-demand tailwind backs the buy-and-hold thesis.
- At projected returns (10.0% appreciation + 0.0% rent growth), your $64k cash investment doubles in ~3 years — after that, you're playing with house money.
- By year 2, paydown + projected appreciation supports a ~$40k cash-out refi (75% LTV) — recoverable capital for the next deal without selling this one.
Negotiation context
- It's been on market 16 days — a 2% lower offer ($227k) is reasonable based on typical stale-listing flexibility.
- 10 sale attempts since 5y ago with the ask held roughly flat each time — persistent listings suggest the price (not the market) is what's stuck; bring a comps-based counter.
Questions for the listing agent
- Is there a deadline driving the sale (1031 exchange, divorce, estate, relocation)? That informs how much negotiation room exists.
- Schools are F-rated, which usually means shorter tenancies and higher turnover. Who's the typical renter profile here, and what's been the actual vacancy rate?
- Crime grade is F in this area — have there been break-ins, vandalism, or insurance claims at this property in the last 3 years? What carrier currently insures it and at what premium?
- What's the average days-on-market for RENTAL listings here right now (not sales)? A rising rental-DOM trend means longer vacancies and softer asking-rent achievability than the comps imply.
- What's the recent tenant-quality profile in this submarket — average credit score on applications, eviction rate, late-payment / NSF rate, and stable-employment percentage? A property-management company in the area should have these aggregated.
- How much new for-sale + rental construction is in the pipeline within 1–3 miles? Heavy new supply typically softens prices + rents 12–24 months out; constrained supply supports both.
Investment metrics
- 1% rule
- 0.90% ✗
- Cap rate
- 6.51%
- Cash-on-cash
- 0.78%
- DSCR
- 1.03
- GRM
- 9.3
CMA / ARV
- ARV (on-the-fly)
- $260,400
- Comps found
- 1
Show comp detail 1 sale within ~0.75 mi
| Address | Dist | Beds/Ba | Sqft | Sold | Price | $/sf | Match |
|---|---|---|---|---|---|---|---|
| 759 Timberlake Cir | 0.43mi | 2/2.0 (-1) | 1,344 (-4%) | 22mo | $250,000 | $186 | 50 |
Match score weights: distance 35% · size 25% · config 20% · recency 20%. Top-matched comps best support the ARV.
Projected returns pro-forma
10.0% appreciation · 0.0% rent growth · sell at horizon
- IRR
- 23.8%
- Equity multiple
- 2.89×
- Total profit
- $121,899
- Equity at exit
- $207,202
- IRR
- 20.5%
- Equity multiple
- 6.37×
- Total profit
- $346,113
- Equity at exit
- $446,839
Cash invested: $64,400 (down + closing). Projections, not guarantees.
Landlord ↔ Tenant lean methodology
- Overall (STATE)
- 87 Strongly Landlord-Friendly
- State Tennessee
- 87 Strongly Landlord-Friendly · R+13
- County
- — inherits STATE
- City
- — inherits STATE
ZIP-level market 37876
- Home prices YoY
- 2.4%
- Rents YoY
- -2.6%
- Active inventory
- 1127
- Price-to-rent
- 9.3×
Monthly cashflow live
- Estimated rent
- $2,065 medium interval (Pro) →
- Mortgage (P&I)
- −$1,206
- Tax est. 1.5%
- −$288 /mo · $3,450/yr
- Insurance
- −$96
- HOA
- −$0
- Vacancy / Maint / Mgmt
- −$434
- Net cashflow
- $42
Break-even live
UW: 25.0% down · 7.5% · 30yr · 1.5% tax · 5.0% vac · 8.0% maint · 8.0% mgmt
Financing live
Cash to close
- Down payment
- $57,500
- Closing costs
- $6,900
- Reserves months
- —
- Total cash needed
- —
Loan-product check · same deal, 3 products live
Conventional
25% down · 7.5% · 30yr
- Down + closing
- —
- Monthly P&I
- —
- Monthly cashflow
- —
- DSCR
- —
- Eligible?
- —
Personal DTI + credit; lowest rate.
DSCR
20% down · 8.5% · 30yr
- Down + closing
- —
- Monthly P&I
- —
- Monthly cashflow
- —
- DSCR
- —
- Eligible?
- —
No personal income docs; deal must DSCR.
Hard money
10% down · 12.0% · 12mo
- Down + closing
- —
- Monthly P&I
- —
- Monthly cashflow
- —
- DSCR
- —
- Eligible?
- —
Short-term bridge; refi at stabilization.
Rent comps 1 comps
| Address | Beds | Baths | Sqft | Rent | $/sqft | DOM | Units | Dist |
|---|---|---|---|---|---|---|---|---|
| 1150 Sanctuary Shores Way Sevierville, TN | 2.0 | 2.0 | 1440 | $2,800 | $1.94 | 43d | 1 | 0.74mi |
Listing history 12 events
-
2026-06-19days on market $230,000 Active 16 DOM
-
2026-06-18days on market $230,000 Active 15 DOM
-
2026-06-17days on market $230,000 Active 14 DOM
-
2026-06-16days on market $230,000 Active 13 DOM
-
2026-06-15days on market $230,000 Active 12 DOM
-
2026-06-14days on market $230,000 Active 10 DOM
-
2026-06-13days on market $230,000 Active 9 DOM
-
2026-06-10days on market $230,000 Active 7 DOM
-
2026-06-09days on market $230,000 Active 6 DOM
-
2026-06-08days on market $230,000 Active 5 DOM
-
2026-06-07remarks 548-char remark
-
2026-06-07$230,000 Active 4 DOM
ⓘ Source: listings_history table (triggers on properties + properties_extension) + one-shot
backfill from property_details.listing_events for pre-trigger history.
Nearby sold comps map
Loading sold comps map…
Walkable amenities ~0.75 mi
Loading nearby amenities…
Taxation est. · year 1
- Rental income
- $24,777
- − Mortgage interest
- −$12,884
- − Property taxes
- −$3,450
- − Insurance
- −$1,150
- − Repairs & maintenance
- −$1,982
- − Management
- −$1,982
- − Depreciation
- −$6,691
- Taxable loss
- −$3,362
- Est. tax savings @ 24.0%
- +$807
- After-tax cash flow
- $1,307/yr
For passive investors: Depreciation is non-cash, so a rental often shows a tax loss while cash-flowing — sheltering income. Rental losses are passive: they offset passive income freely, and up to $25,000/yr can offset ordinary (W-2) income if you actively participate and your MAGI is under $100k (phasing out to $0 by $150k); unused losses carry forward. On sale, claimed depreciation is recaptured at up to 25%, and gains may owe capital-gains tax (a 1031 exchange can defer both). Figures are a year-1 estimate at your 24.0% rate — not tax advice; consult a CPA.
Schools (NCES district)
- District
- Sevier County
- NCES district ID
- 4703780
- Math proficiency
- 31% ▼ -6.00%
- Reading proficiency
- 28% ▼ -4.00%
- Median HH income
- $42,730
- Composite
- 25.12/100
- National rank
- #7527
- State rank
- #62 of 139 in TN
Livability — Fairgarden
- Score
- 54/100
- State rank
- #381
- US rank
- #24205
Category grades
Schools grade is shown separately in the Schools card above.
Census & demographics
- County
- Sevier County · 80,402 people
- Metro
- Sevierville, TN
- Population (ZIP)
- 33,561
- Household income
- $58,277
- Rent vs Own
- Severe rent burden
- 611.0
Population outlook (Sevier County) Hauer SSP2
- Today (2025)
- 107,903 people
- By 2030
- 113,633 · +5.3%
- By 2040
- 123,969 · +14.9%
- By 2050
- 132,123 · +22.4%
- By 2075
- 148,524 · +37.6%
- By 2100
- 153,436 · +42.2%
Race, ethnicity, and origin ACS 2023
- Neighborhood character
- Predominantly White (89%)
- Race & ethnicity
- White 89% Hispanic / Latino 5% Two or more races 5% Black 1%
- Common ancestry
- Slovak 5% Serbian 4% Romanian 2%
- Foreign-born
- 3% · Canada
- Languages at home
- 95% English-only · Spanish 3% Russian/Polish/Slavic 1%
Political lean MEDSL · Sevier
- 2024 margin
- Solid R (+61.1) · D 18.9% · R 80.1% · Other 1.0%
- 2008→2024 swing
- -13.1pp toward R · 2008: -48.1pp · 2024: -61.1pp
- All cycles
- 2024: R+61.1 2020: R+57.6 2016: R+61.7 2012: R+54.8 2008: R+48.1
Not yet ingested
- Civics
- —
Market trends
- HPI YoY
- ▲ 11.06%
- Current HPI
- 477.19
- Rent YoY
- ▼ -2.57%
- Metro
- Sevierville, TN
- State GDP YoY
- ▲ 2.78%
- F500 in state
- 22
Industry mix (Fortune 500 HQ in TN)
| Industry | F500 HQs | Revenue |
|---|---|---|
| Healthcare | 3 | $91B |
|
||
| Retail | 3 | $72B |
|
||
| Transportation / Logistics | 1 | $88B |
|
||
| Paper / Packaging | 1 | $19B |
|
||
| Insurance | 1 | $13B |
|
||
| Energy | 1 | $12B |
|
||
Price history
+721.4% since first listed36 events — show timeline
- 2026-06-03 Listed $230,000 GSMAR
- 2025-12-28 Listed $195,000 REALTRACS as Distributed by MLS Grid
- 2023-12-01 Sold (Public Records) $227,000 Public Records
- 2023-12-01 Sold (MLS) $227,000 Knoxville MLS
- 2023-12-01 Sold (MLS) $227,000 GSMAR
- 2023-11-05 Pending — GSMAR
- 2023-11-05 Contingent — Knoxville MLS
- 2023-10-21 Price Changed $227,900 Knoxville MLS
- 2023-10-21 Price Changed $227,900 GSMAR
- 2023-09-29 Relisted — GSMAR
- 2023-09-29 Relisted — Knoxville MLS
- 2023-07-28 Delisted — GSMAR
- 2023-07-27 Listing Removed — Knoxville MLS
- 2023-06-25 Listed $229,900 GSMAR
- 2023-06-24 Listed $229,900 Knoxville MLS
- 2023-06-20 Coming Soon $229,900 Knoxville MLS
- 2023-05-24 Listing Removed — Knoxville MLS
- 2023-04-15 Contingent — Knoxville MLS
- 2023-03-23 Price Changed $230,000 Knoxville MLS
- 2023-03-10 Listed $249,000 Knoxville MLS
- 2023-02-28 Coming Soon — Knoxville MLS
- 2022-04-08 Sold (Public Records) $200,000 Public Records
- 2022-04-06 Sold (MLS) $200,000 Knoxville MLS
- 2022-04-06 Sold (MLS) $200,000 GSMAR
- 2022-04-06 Sold (MLS) $200,000 REALTRACS as Distributed by MLS Grid
- 2022-03-14 Contingent — Knoxville MLS
- 2022-01-30 Relisted — Knoxville MLS
- 2022-01-19 Contingent — Knoxville MLS
- 2022-01-17 Listed $195,000 Knoxville MLS
- 2021-03-18 Sold (Public Records) $45,000 Public Records
- 2021-03-17 Sold (MLS) $45,000 Knoxville MLS
- 2021-03-02 Contingent — Knoxville MLS
- 2021-02-12 Listed $48,900 Knoxville MLS
- 2008-05-12 Sold (Public Records) $80,100 Public Records
- 2001-11-05 Sold (Public Records) $30,000 Public Records
- 1989-02-03 Sold (Public Records) $28,000 Public Records
Property tax history
+13.4%/yrLatest (2025): $438 · +0.0% YoY. Source: county tax records.
Cash-flow waterfall
monthlySold comps — $/sqft
last 12 mo · ≤1 miLoading sold comps…