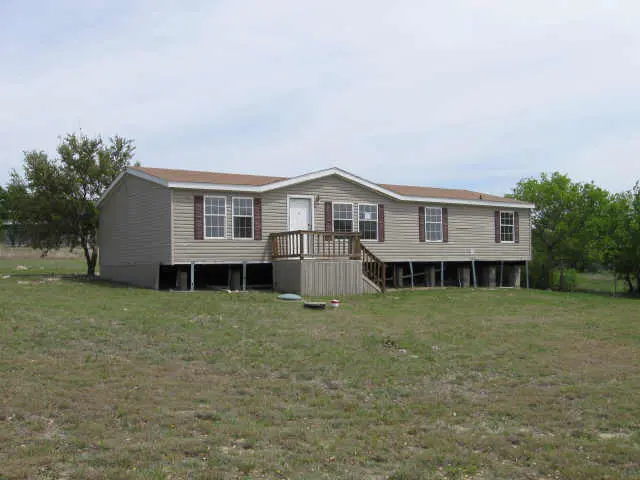
134 Browning Ct
Carter, TX 76082
$255,000D+
4 bd · 2.0 ba ·
2,128 sqft ·
Built 2002
· Manufactured
· Active
· 30 DOM
Cashflow @ list (25.0% down · 7.5%)
Estimated rent
$2,257/mo
Mortgage (P&I)
−$1,337
Tax + insurance
−$431
HOA
−$0
Vac / Maint / Mgmt
−$474
Net cashflow
$15/mo
Annual
$174/yr
Cap rate
6.36%
Cash-on-cash
0.24%
DSCR
1.01
1% rule
0.89%
Cash to close
$71,400
Investor read
- This is a 4-bed/2.0-bath manufactured listed at $255k.
- At list price, monthly cash flow is $15 ($174/yr) — positive.
- The deal already cash-flows at list — no discount required.
- To meet the 1% rule (rent ≥ 1% of price), the offer needs to be $226k (11.5% below list).
- It's been on market 30 days — a 2% lower offer ($251k) is reasonable based on typical stale-listing flexibility.
- Recommended offer: $226k (11.5% below list) — sets the bar for 1% rule.
- Local home prices are declining (-3.0%/yr); year-one equity from $2k of loan paydown is wiped out by about $8k of value loss. Plan a longer hold.
- Location reads: area grade D — affects rentability + tenant quality, not the cash-flow math above.
- Weatherford ISD (town): math 39% / reading 44% proficiency, ranked #321 of 826 in TX (top 39%) — families likely to look elsewhere, expect single-tenant / working-renter base with shorter leases.
- Zoned schools: Wright El (math 32% / reading 32%, grade F, #2,268 of 4,322 statewide, top 55%, 575 students, 56% FRL); Tison Middle (math 37% / reading 43%, grade F, #646 of 1,662 statewide, top 40%, 879 students, 46% FRL); Weatherford H S (math 33% / reading 53%, grade F, #713 of 1,632 statewide, top 44%, 2,525 students, 40% FRL).
- Market conditions: 528 active listings in the ZIP; solid renter incomes; 437 units permitted in Parker County in 2024 (0 in 5+ unit buildings).
- Parker County population projected at +32% by 2050 — long-run rental-demand tailwind backs the buy-and-hold thesis.
- 2 sale attempts since 17y ago with the ask held roughly flat each time — persistent listings suggest the price (not the market) is what's stuck; bring a comps-based counter.
- Climate carrying-cost: major wildfire risk; extreme-heat days projected 7→22/yr by 2055 (HVAC capex compounding) — expect insurance premiums to compound above CPI over the hold.
- Cap rate 6.4% vs local median 2.5% in Carter — top-decile yield for the area; either an underpriced asset or a hidden risk that comps aren't pricing in. Stress-test before assuming the spread holds.
Questions for listing agent
- Is there a deadline driving the sale (1031 exchange, divorce, estate, relocation)? That informs how much negotiation room exists.
- The area grade is low — what's the realistic commute time and amenity access for the typical tenant pool here? Any planned neighborhood developments (good or bad) we should know about?
- What's the average days-on-market for RENTAL listings here right now (not sales)? A rising rental-DOM trend means longer vacancies and softer asking-rent achievability than the comps imply.
- What's the recent tenant-quality profile in this submarket — average credit score on applications, eviction rate, late-payment / NSF rate, and stable-employment percentage? A property-management company in the area should have these aggregated.
- How much new for-sale + rental construction is in the pipeline within 1–3 miles? Heavy new supply typically softens prices + rents 12–24 months out; constrained supply supports both.
CashFlowRE · CFR-6B8ZJZEZ7A65TZ
· Data 22 h ago
cashflowre.app · 2026-05-29