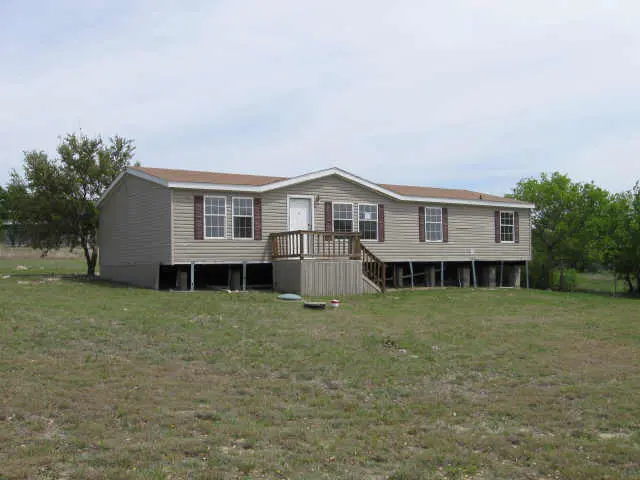
134 Browning Ct · Carter, TX
Flood risk 1/10 · Minimal
- FEMA flood zone
- X (unshaded)
- Chance of flooding over 30 yrs
- 0.0%
- Est. flood insurance / yr
- $507 – $1,088
Fire risk 7/10 · Major
- Est. fire insurance / yr
- $1,222 – $2,270
Heat risk 7/10 · Major
- Hot days now (above 108°F)
- 7 days/yr
- Hot days in 30 yrs
- 22 days/yr
Wind risk 4/10 · Minor
- Chance of severe wind over 30 yrs
- 21.0%
Air-quality risk 2/10 · Minimal
- Unhealthy air days now
- 1 days/yr
- Unhealthy air days in 30 yrs
- 1 days/yr
Risk factors via First Street. Map © Google.
Why this score? — see what drove the D+ grade
The composite is a weighted blend of 9 inputs, each scored 0–100. Each bar is that input's sub-score; the figure is the points it added to the 100-point composite (weight × sub-score).
- ARV discount +14.8/15.0
- Cash flow +13.6/30.0
- DSCR +4.1/10.0
- 1% rule +3.9/10.0
- Schools +3.6/10.0
- Rent growth +2.5/5.0
- Livability +2.5/5.0
- Condition / age +2.5/5.0
- Appreciation +0.0/10.0
$255,000
🖨 Deal sheet (PDF) 📄 Offer letter ✓ Due diligence
Listing remarks MLS
NICE 3-2 ON 1.72 ACRES. 2 LIVING AREAS, SPLIT BEDROOMS. NEEDS STOVE AND OUTSIDE AC UNITS. BUYER TO VERIFY ALL INFO.
Key facts
- 1.72 acre lot
- Built 2002
- Listed 30 days
Property features AI
Finance
- Other: Deed restrictions; Lot is approximately 1.72 acres and will not subdivide
- Financial info: Listing accepts Cash, Conventional, FHA, and VA financing
- HOA & community: No association
Exterior
- Parking: Driveway (no garage or covered/carport spaces)
- Security: Audio and video consent for visitors to record present
- Utilities: Aerobic septic; Not in a municipal utility district
- Home design: Single-family residence (attached); One story
- Construction: Built in 2002; Vinyl siding; Composition roof; Pillar/post/pier foundation
- Exterior features: Acreage lot; Easements for utilities; Soil: black and clay; Horse permitted
Interior
- Kitchen: Dishwasher
- Bedrooms: 4 bedrooms; Primary bedroom on level 1 (approx. 14 x 12)
- Flooring: Carpet; Vinyl
- Bathrooms: 2 full bathrooms
- Heating & cooling: Central heating (electric); Central air conditioning (electric)
- Interior features: Decorative lighting; One living area; One dining area; 2 total bathrooms; Wood-burning fireplace
- Laundry & utility: No specific laundry details provided
Neighborhood map
What this means for you Summary
Snapshot
- This is a 4-bed/2.0-bath manufactured listed at $255k.
Deal economics
- At list price, monthly cash flow is $15 ($174/yr) — positive.
- The deal already cash-flows at list — no discount required.
- To meet the 1% rule (rent ≥ 1% of price), the offer needs to be $226k (11.5% below list).
- Recommended offer: $226k (11.5% below list) — sets the bar for 1% rule.
- Cap rate 6.4% vs local median 2.5% in Carter — top-decile yield for the area; either an underpriced asset or a hidden risk that comps aren't pricing in. Stress-test before assuming the spread holds.
Location & tenants
- Location reads: area grade D — affects rentability + tenant quality, not the cash-flow math above.
- Weatherford ISD (town): math 39% / reading 44% proficiency, ranked #321 of 826 in TX (top 39%) — families likely to look elsewhere, expect single-tenant / working-renter base with shorter leases.
- Zoned schools: Wright El (math 32% / reading 32%, grade F, #2,268 of 4,322 statewide, top 55%, 575 students, 56% FRL); Tison Middle (math 37% / reading 43%, grade F, #646 of 1,662 statewide, top 40%, 879 students, 46% FRL); Weatherford H S (math 33% / reading 53%, grade F, #713 of 1,632 statewide, top 44%, 2,525 students, 40% FRL).
- Market conditions: 528 active listings in the ZIP; solid renter incomes; 437 units permitted in Parker County in 2024 (0 in 5+ unit buildings).
Forward outlook
- Local home prices are declining (-3.0%/yr); year-one equity from $2k of loan paydown is wiped out by about $8k of value loss. Plan a longer hold.
- Parker County population projected at +32% by 2050 — long-run rental-demand tailwind backs the buy-and-hold thesis.
Negotiation context
- It's been on market 30 days — a 2% lower offer ($251k) is reasonable based on typical stale-listing flexibility.
- 2 sale attempts since 17y ago with the ask held roughly flat each time — persistent listings suggest the price (not the market) is what's stuck; bring a comps-based counter.
Risks & watch-outs
- Climate carrying-cost: major wildfire risk; extreme-heat days projected 7→22/yr by 2055 (HVAC capex compounding) — expect insurance premiums to compound above CPI over the hold.
Questions for the listing agent
- Is there a deadline driving the sale (1031 exchange, divorce, estate, relocation)? That informs how much negotiation room exists.
- The area grade is low — what's the realistic commute time and amenity access for the typical tenant pool here? Any planned neighborhood developments (good or bad) we should know about?
- What's the average days-on-market for RENTAL listings here right now (not sales)? A rising rental-DOM trend means longer vacancies and softer asking-rent achievability than the comps imply.
- What's the recent tenant-quality profile in this submarket — average credit score on applications, eviction rate, late-payment / NSF rate, and stable-employment percentage? A property-management company in the area should have these aggregated.
- How much new for-sale + rental construction is in the pipeline within 1–3 miles? Heavy new supply typically softens prices + rents 12–24 months out; constrained supply supports both.
Investment metrics
- 1% rule
- 0.89% ✗
- Cap rate
- 6.36%
- Cash-on-cash
- 0.24%
- DSCR
- 1.01
- GRM
- 9.4
CMA / ARV
- ARV (on-the-fly)
- $304,304
- Comps found
- 2
Show comp detail 2 sales within ~0.75 mi
| Address | Dist | Beds/Ba | Sqft | Sold | Price | $/sf | Match |
|---|---|---|---|---|---|---|---|
| 112 Cabot | 0.17mi | 4/2.0 | 2,128 (0%) | 11mo | $250,000 | $117 | 83 |
| 7133 Hutcheson Hill Rd | 0.54mi | 4/2.0 | 2,063 (-3%) | 18mo | $295,000 | $143 | 54 |
Match score weights: distance 35% · size 25% · config 20% · recency 20%. Top-matched comps best support the ARV.
Projected returns pro-forma
-3.0% appreciation · 3.0% rent growth · sell at horizon
- IRR
- -15.9%
- Equity multiple
- 0.43×
- Total profit
- $-40,358
- Equity at exit
- $38,021
- IRR
- -7.5%
- Equity multiple
- 0.53×
- Total profit
- $-33,797
- Equity at exit
- $22,048
Cash invested: $71,400 (down + closing). Projections, not guarantees.
Landlord ↔ Tenant lean methodology
- Overall (STATE)
- 87 Strongly Landlord-Friendly
- State Texas
- 87 Strongly Landlord-Friendly · R+5
- County
- — inherits STATE
- City
- — inherits STATE
ZIP-level market 76082
- Home prices YoY
- -21.5%
- Active inventory
- 528
- Price-to-rent
- 9.4×
Monthly cashflow live
- Estimated rent
- $2,257 medium interval (Pro) →
- Mortgage (P&I)
- −$1,337
- Tax from tax record
- −$325 /mo · $3,901/yr
- Insurance
- −$106
- HOA
- −$0
- Vacancy / Maint / Mgmt
- −$474
- Net cashflow
- $15
Break-even live
Sensitivity live
| Price | -10% $159 | -5% $87 | +0% $15 | +5% $-58 | +10% $-130 |
|---|---|---|---|---|---|
| Rent | -10% $-164 | -5% $-75 | +0% $15 | +5% $104 | +10% $193 |
| Rate | -1.0pp $143 | -0.5pp $79 | base $15 | +0.5pp $-52 | +1.0pp $-119 |
UW: 25.0% down · 7.5% · 30yr · 1.5% tax · 5.0% vac · 8.0% maint · 8.0% mgmt
Financing live
Cash to close
- Down payment
- $63,750
- Closing costs
- $7,650
- Reserves months
- —
- Total cash needed
- —
Loan-product check · same deal, 3 products live
Conventional
25% down · 7.5% · 30yr
- Down + closing
- —
- Monthly P&I
- —
- Monthly cashflow
- —
- DSCR
- —
- Eligible?
- —
Personal DTI + credit; lowest rate.
DSCR
20% down · 8.5% · 30yr
- Down + closing
- —
- Monthly P&I
- —
- Monthly cashflow
- —
- DSCR
- —
- Eligible?
- —
No personal income docs; deal must DSCR.
Hard money
10% down · 12.0% · 12mo
- Down + closing
- —
- Monthly P&I
- —
- Monthly cashflow
- —
- DSCR
- —
- Eligible?
- —
Short-term bridge; refi at stabilization.
Listing history 21 events
-
2026-06-21days on market $255,000 Active 30 DOM
-
2026-06-18days on market $255,000 Active 27 DOM
-
2026-06-17days on market $255,000 Active 26 DOM
-
2026-06-16days on market $255,000 Active 25 DOM
-
2026-06-15days on market $255,000 Active 24 DOM
-
2026-06-13days on market $255,000 Active 22 DOM
-
2026-06-09days on market $255,000 Active 18 DOM
-
2026-06-08days on market $255,000 Active 17 DOM
-
2026-06-07days on market $255,000 Active 16 DOM
-
2026-06-04days on market $255,000 Active 13 DOM
-
2026-06-03days on market $255,000 Active 12 DOM
-
2026-06-02days on market $255,000 Active 11 DOM
-
2026-06-01days on market $255,000 Active 10 DOM
-
2026-05-31days on market $255,000 Active 9 DOM
-
2026-05-22$255,000 Active
-
2009-08-18soldstatus
-
2009-08-14soldstatus 115-char remark
Show marketing remark (115 chars)
NICE 3-2 ON 1.72 ACRES. 2 LIVING AREAS, SPLIT BEDROOMS. NEEDS STOVE AND OUTSIDE AC UNITS. BUYER TO VERIFY ALL INFO.
-
2009-06-22historical 115-char remark
Show marketing remark (115 chars)
NICE 3-2 ON 1.72 ACRES. 2 LIVING AREAS, SPLIT BEDROOMS. NEEDS STOVE AND OUTSIDE AC UNITS. BUYER TO VERIFY ALL INFO.
-
2009-04-28$35,100 115-char remark
Show marketing remark (115 chars)
NICE 3-2 ON 1.72 ACRES. 2 LIVING AREAS, SPLIT BEDROOMS. NEEDS STOVE AND OUTSIDE AC UNITS. BUYER TO VERIFY ALL INFO.
-
2004-12-30soldstatus
-
2002-05-07soldstatus
ⓘ Source: listings_history table (triggers on properties + properties_extension) + one-shot
backfill from property_details.listing_events for pre-trigger history.
Tax reassessment forecast TX · Resets to sale price
- Current annual tax
- $3,901 · $325/mo
- Projected year-2 tax
- $4,666 · $389/mo
- Expected delta
- +$765/yr (+$64/mo · 19.6%)
ⓘ Screening estimate from a state-policy table — verify with the county assessor before closing.
Climate risk First Street
- Flood 1/10 Low FEMA zone X (unshaded) · 0% chance over 30 yrs
- Wildfire 7/10 Severe
- Heat 7/10 Severe 7 d/yr ≥108°F today · 22 d/yr by 30 yrs out
- Wind 4/10 Moderate 21% chance of damaging wind over 30 yrs
- Air quality 2/10 Low 1 unhealthy d/yr today · 1 by 30 yrs out
Nearby sold comps map
Loading sold comps map…
Walkable amenities ~0.75 mi
Loading nearby amenities…
Taxation est. · year 1
- Rental income
- $27,086
- − Mortgage interest
- −$14,284
- − Property taxes
- −$3,901
- − Insurance
- −$1,275
- − Repairs & maintenance
- −$2,167
- − Management
- −$2,167
- − Depreciation
- −$7,418
- Taxable loss
- −$4,127
- Est. tax savings @ 24.0%
- +$990
- After-tax cash flow
- $1,165/yr
For passive investors: Depreciation is non-cash, so a rental often shows a tax loss while cash-flowing — sheltering income. Rental losses are passive: they offset passive income freely, and up to $25,000/yr can offset ordinary (W-2) income if you actively participate and your MAGI is under $100k (phasing out to $0 by $150k); unused losses carry forward. On sale, claimed depreciation is recaptured at up to 25%, and gains may owe capital-gains tax (a 1031 exchange can defer both). Figures are a year-1 estimate at your 24.0% rate — not tax advice; consult a CPA.
Schools (NCES district)
- District
- Weatherford ISD
- NCES district ID
- 4844800
- Math proficiency
- 39% ▼ -3.00%
- Reading proficiency
- 44% ▼ -2.00%
- Median HH income
- $57,087
- Composite
- 36.4/100
- National rank
- #4679
- State rank
- #321 of 826 in TX
Livability — Carter
No livability data for this city. (Only ~50 U.S. cities are tracked.)
Census & demographics
- Census place
- Carter, TX
- County
- Parker County · 144,797 people
- Metro
- Dallas-Fort Worth-Arlington, TX
- Population (ZIP)
- 24,880
- Household income
- $92,485
- Rent vs Own
- Severe rent burden
- 333.0
Population outlook (Parker County) Hauer SSP2
- Today (2025)
- 147,426 people
- By 2030
- 157,863 · +7.1%
- By 2040
- 177,519 · +20.4%
- By 2050
- 194,786 · +32.1%
- By 2075
- 238,799 · +62.0%
- By 2100
- 264,126 · +79.2%
Race, ethnicity, and origin ACS 2023
- Neighborhood character
- Predominantly White (80%)
- Race & ethnicity
- White 80% Hispanic / Latino 13% Two or more races 11%
- Hispanic origin (detail)
- Mexican 12%
- Common ancestry
- Slovak 3% Lithuanian 2% Italian 2%
- Foreign-born
- 4% · Canada
- Languages at home
- 93% English-only · Spanish 6%
Political lean MEDSL · Parker
- 2024 margin
- Solid R (+66.4) · D 16.4% · R 82.8%
- 2008→2024 swing
- -11.2pp toward R · 2008: -55.2pp · 2024: -66.4pp
- All cycles
- 2024: R+66.4 2020: R+64.4 2016: R+67.5 2012: R+65.8 2008: R+55.2
Not yet ingested
- Civics
- —
Market trends
- HPI YoY
- ▼ -71.65%
- Current HPI
- 262.1991
- Rent YoY
- —
- Metro
- Dallas-Fort Worth-Arlington, TX
- State GDP YoY
- ▲ 3.95%
- F500 in state
- 110
Industry mix (Fortune 500 HQ in TX)
| Industry | F500 HQs | Revenue |
|---|---|---|
| Energy | 16 | $1,198B |
|
||
| Technology | 5 | $198B |
|
||
| Engineering / Construction | 4 | $72B |
|
||
| Energy Services | 3 | $60B |
|
||
| Utilities | 3 | $41B |
|
||
| Healthcare | 2 | $330B |
|
||
Price history
+626.5% since first listed7 events — show timeline
- 2026-05-22 Listed $255,000 NTREIS
- 2009-08-18 Sold (Public Records) — Public Records
- 2009-08-14 Sold (MLS) — NTREIS
- 2009-06-22 Listing Removed — NTREIS
- 2009-04-28 Listed $35,100 NTREIS
- 2004-12-30 Sold (Public Records) — Public Records
- 2002-05-07 Sold (Public Records) — Public Records
Property tax history
+5.7%/yrLatest (2025): $3,901 · +24.2% YoY. Source: county tax records.
Cash-flow waterfall
monthlySold comps — $/sqft
last 12 mo · ≤1 miLoading sold comps…