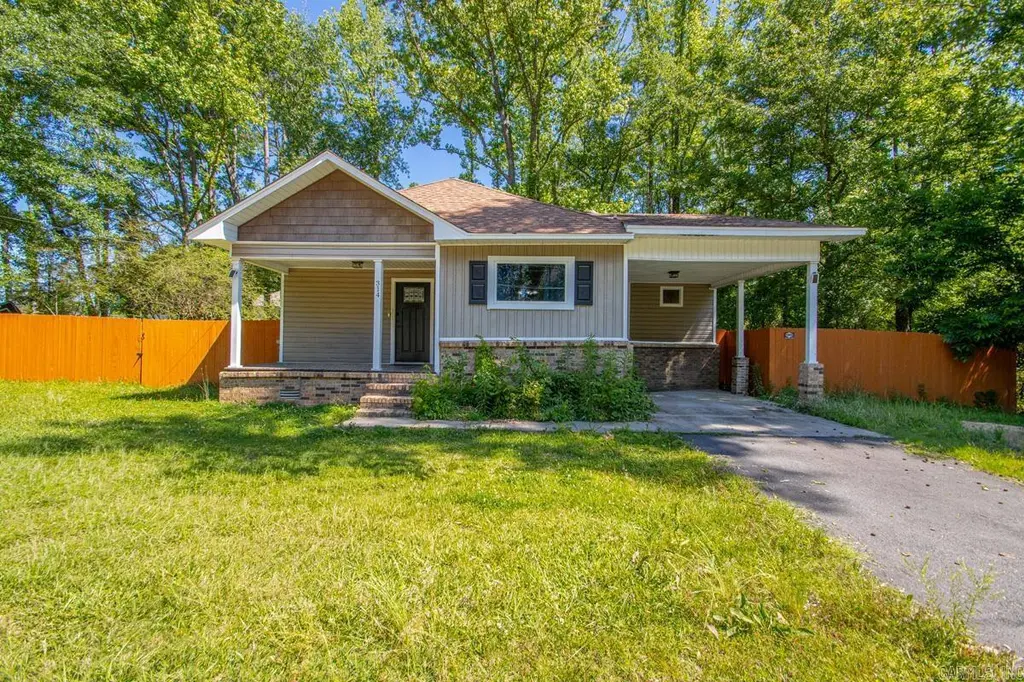
314 W Church St
Sheridan, AR 72150
$154,000F
3 bd · 1.0 ba ·
1,066 sqft ·
Built —
· SingleFamily
· Under Contract
· 2 DOM
Cashflow @ list (25.0% down · 7.5%)
Estimated rent
$1,176/mo
Mortgage (P&I)
−$808
Tax + insurance
−$257
HOA
−$0
Vac / Maint / Mgmt
−$247
Net cashflow
$-135/mo
Annual
$-1,620/yr
Cap rate
5.24%
Cash-on-cash
-3.76%
DSCR
0.83
1% rule
0.76%
Cash to close
$43,120
Investor read
- This is a 3-bed/1.0-bath single-family listed at $154k.
- At list price, monthly cash flow is $-135 ($-2k/yr) — negative.
- To cash-flow at today's rent, offer at most $134k (12.7% below list).
- To meet the 1% rule (rent ≥ 1% of price), the offer needs to be $118k (23.6% below list).
- Only 2 days on market — expect competitive offers; lowballing is unlikely to land.
- Recommended offer: $118k (23.6% below list) — sets the bar for 1% rule.
- Local home prices are declining (-3.0%/yr); year-one equity from $1k of loan paydown is wiped out by about $5k of value loss. Plan a longer hold.
- Location reads 68/100 on livability (#85 in AR) — a middle-class / working-renter tenant base. Strengths: cost of living A+, housing A+, health & safety A; Watch: employment C-, crime D, amenities F.
- Sheridan School District (town): math 36% / reading 38% proficiency, ranked #89 of 238 in AR (top 37%) — families likely to look elsewhere, expect single-tenant / working-renter base with shorter leases.
- Zoned schools: Sheridan Elementary School (596 students, 47% FRL); Sheridan Middle School (math 40% / reading 44%, grade D-, #78 of 201 statewide, top 40%, 609 students, 42% FRL); Sheridan High School (math 26% / reading 36%, grade F, #131 of 292 statewide, top 45%, 1,271 students, 35% FRL) — zoned schools at 41% FRL track the district average.
- Market conditions: 142 active listings in the ZIP; 28 units permitted in Grant County in 2024 (0 in 5+ unit buildings).
- Grant County population projected to shrink 3% by 2050 — rents likely to lag national; underwrite the cash flow, not the appreciation.
- 6 sale attempts since 11y ago with the ask held roughly flat each time — persistent listings suggest the price (not the market) is what's stuck; bring a comps-based counter.
- Climate carrying-cost: extreme-heat days projected 7→21/yr by 2055 (HVAC capex compounding) — expect insurance premiums to compound above CPI over the hold.
- Cap rate 5.2% vs local median 3.7% in Sheridan — top-decile yield for the area; either an underpriced asset or a hidden risk that comps aren't pricing in. Stress-test before assuming the spread holds.
Questions for listing agent
- What do current leases actually rent for vs. the listed asking? Can we see a recent rent roll and the last 12 months of T-12 income?
- Is there a deadline driving the sale (1031 exchange, divorce, estate, relocation)? That informs how much negotiation room exists.
- Crime grade is D in this area — have there been break-ins, vandalism, or insurance claims at this property in the last 3 years? What carrier currently insures it and at what premium?
- The area grade is low — what's the realistic commute time and amenity access for the typical tenant pool here? Any planned neighborhood developments (good or bad) we should know about?
- What's the average days-on-market for RENTAL listings here right now (not sales)? A rising rental-DOM trend means longer vacancies and softer asking-rent achievability than the comps imply.
- What's the recent tenant-quality profile in this submarket — average credit score on applications, eviction rate, late-payment / NSF rate, and stable-employment percentage? A property-management company in the area should have these aggregated.
- How much new for-sale + rental construction is in the pipeline within 1–3 miles? Heavy new supply typically softens prices + rents 12–24 months out; constrained supply supports both.
CashFlowRE · CFR-6BDM0R7MGM161F
· Data 4 weeks ago
cashflowre.app · 2026-05-29