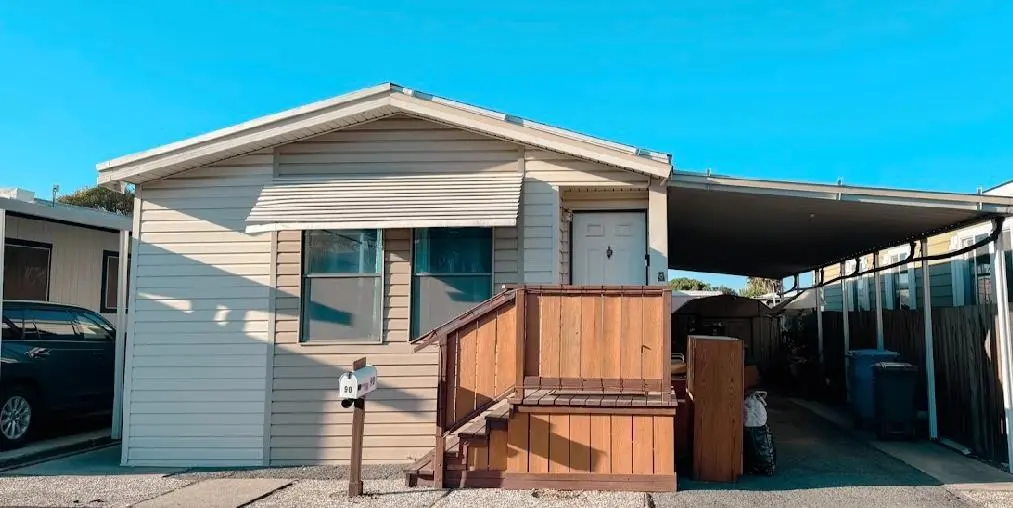
55 Pacifica Ave #90
Bay Point, CA 94565
$110,000B+
2 bd · 2.0 ba ·
1,032 sqft ·
Built 1990
· Manufactured
· Active
· 57 DOM
Cashflow @ list (25.0% down · 7.5%)
Estimated rent
$2,324/mo
Mortgage (P&I)
−$577
Tax + insurance
−$183
HOA
−$0
Vac / Maint / Mgmt
−$488
Net cashflow
$1,076/mo
Annual
$12,912/yr
Cap rate
18.03%
Cash-on-cash
41.92%
DSCR
2.87
1% rule
2.11%
Cash to close
$30,800
Investor read
- This is a 2-bed/2.0-bath manufactured listed at $110k.
- At list price, monthly cash flow is $1k ($13k/yr) — positive.
- The deal already cash-flows at list — no discount required.
- Meets the 1% rule at list price ($2k rent vs $110k).
- It's been on market 57 days — a 3% lower offer ($107k) is reasonable based on typical stale-listing flexibility.
- Recommended offer: $107k (3.0% below list) — sets the bar for market timing.
- Local home prices are declining (-3.0%/yr); year-one equity from $761 of loan paydown is wiped out by about $3k of value loss. Plan a longer hold.
- Location reads 57/100 on livability (#736 in CA) — a working-class tenant base; expect higher turnover. Strengths: housing A+, employment B+, health & safety B+; Watch: crime F, amenities F, commute F.
- Mt. Diablo Unified (suburban): math 36% / reading 45% proficiency, ranked #202 of 517 in CA (top 39%) — families likely to look elsewhere, expect single-tenant / working-renter base with shorter leases.
- Zoned schools: Rio Vista Elementary (math 9% / reading 17%, grade F, #1,463 of 1,571 statewide, top 94%, 446 students, 83% FRL); Riverview Middle (math 10% / reading 21%, grade F, #455 of 498 statewide, top 92%, 766 students, 76% FRL); Mt. Diablo High (math 22% / reading 47%, grade F, #618 of 1,170 statewide, top 56%, 1,498 students, 61% FRL) — zoned schools average 73% FRL vs 37% district-wide (36 pts higher); higher-poverty schools than district average — tighter screening recommended.
- Zoned-school proficiency averages 21% at this address vs 40% district-wide (-20 pts) — the specific schools serving this property underperform the Mt. Diablo Unified average; the district grade overstates school quality for this exact location.
- Market conditions: Rents rising (+1.1%/yr); 271 active listings in the ZIP; 10 comparable units currently listed for rent nearby; rentals leasing fast (median 4d on market — plan ~1-2 weeks tenant-placement turnaround); solid renter incomes; 2,169 units permitted in Contra Costa County in 2024 (896 in 5+ unit buildings).
- Contra Costa County population projected at +26% by 2050 — long-run rental-demand tailwind backs the buy-and-hold thesis.
- At projected returns (-3.0% appreciation + 1.1% rent growth), your $31k cash investment doubles in ~3 years — after that, you're playing with house money.
- Climate carrying-cost: major wildfire risk; extreme-heat days projected 7→14/yr by 2055 (HVAC capex compounding) — expect insurance premiums to compound above CPI over the hold.
- Cap rate 18.0% vs local median 3.6% in Bay Point — top-decile yield for the area; either an underpriced asset or a hidden risk that comps aren't pricing in. Stress-test before assuming the spread holds.
Questions for listing agent
- It's been on market 57 days. Have you received any prior offers? Is the seller open to a 3% concession, seller financing, or rate buy-down credit?
- Is there a deadline driving the sale (1031 exchange, divorce, estate, relocation)? That informs how much negotiation room exists.
- Schools are F-rated, which usually means shorter tenancies and higher turnover. Who's the typical renter profile here, and what's been the actual vacancy rate?
- Crime grade is F in this area — have there been break-ins, vandalism, or insurance claims at this property in the last 3 years? What carrier currently insures it and at what premium?
- What's the average days-on-market for RENTAL listings here right now (not sales)? A rising rental-DOM trend means longer vacancies and softer asking-rent achievability than the comps imply.
- What's the recent tenant-quality profile in this submarket — average credit score on applications, eviction rate, late-payment / NSF rate, and stable-employment percentage? A property-management company in the area should have these aggregated.
- How much new for-sale + rental construction is in the pipeline within 1–3 miles? Heavy new supply typically softens prices + rents 12–24 months out; constrained supply supports both.
CashFlowRE · CFR-6BY3ER1SQX3W3Z
· Data 17 h ago
cashflowre.app · 2026-05-29