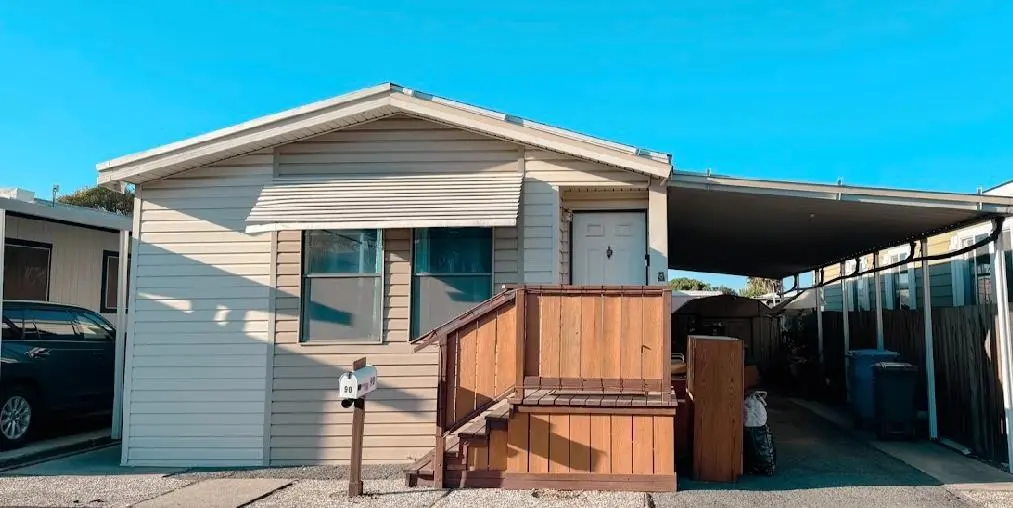
55 Pacifica Ave #90 · Bay Point, CA
Flood risk 1/10 · Minimal
- FEMA flood zone
- X (unshaded)
- Chance of flooding over 30 yrs
- 0.0%
- Est. flood insurance / yr
- $507 – $1,088
Fire risk 6/10 · Moderate
- Est. fire insurance / yr
- $659 – $1,223
Heat risk 5/10 · Moderate
- Hot days now (above 98°F)
- 7 days/yr
- Hot days in 30 yrs
- 14 days/yr
Wind risk 1/10 · Minimal
- Chance of severe wind over 30 yrs
- —
Air-quality risk 9/10 · Severe
- Unhealthy air days now
- 18 days/yr
- Unhealthy air days in 30 yrs
- 19 days/yr
Risk factors via First Street. Map © Google.
Why this score? — see what drove the B+ grade
The composite is a weighted blend of 9 inputs, each scored 0–100. Each bar is that input's sub-score; the figure is the points it added to the 100-point composite (weight × sub-score).
- Cash flow +30.0/30.0
- ARV discount +15.0/15.0
- 1% rule +10.0/10.0
- DSCR +10.0/10.0
- Schools +3.8/10.0
- Livability +2.9/5.0
- Rent growth +2.8/5.0
- Condition / age +2.5/5.0
- Appreciation +0.0/10.0
$110,000
🖨 Deal sheet (PDF) 📄 Offer letter ✓ Due diligence
Listing remarks
Cute 2 bedroom/2bath in Bay Point, over 1000 sqft, covered parking, great kitchen and cabinets, open floor plan, located minutes from HWY 4, close to shopping, schools, and public transportation
Key facts
- Great kitchen
- Open floor plan
- Close to schools
Tags
Neighborhood map
What this means for you Summary
Snapshot
- This is a 2-bed/2.0-bath manufactured listed at $110k.
Deal economics
- At list price, monthly cash flow is $1k ($13k/yr) — positive.
- The deal already cash-flows at list — no discount required.
- Meets the 1% rule at list price ($2k rent vs $110k).
- Recommended offer: $107k (3.0% below list) — sets the bar for market timing.
- Cap rate 18.0% vs local median 3.6% in Bay Point — top-decile yield for the area; either an underpriced asset or a hidden risk that comps aren't pricing in. Stress-test before assuming the spread holds.
Location & tenants
- Location reads 57/100 on livability (#736 in CA) — a working-class tenant base; expect higher turnover. Strengths: housing A+, employment B+, health & safety B+; Watch: crime F, amenities F, commute F.
- Mt. Diablo Unified (suburban): math 36% / reading 45% proficiency, ranked #202 of 517 in CA (top 39%) — families likely to look elsewhere, expect single-tenant / working-renter base with shorter leases.
- Zoned schools: Rio Vista Elementary (math 9% / reading 17%, grade F, #1,463 of 1,571 statewide, top 94%, 446 students, 83% FRL); Riverview Middle (math 10% / reading 21%, grade F, #455 of 498 statewide, top 92%, 766 students, 76% FRL); Mt. Diablo High (math 22% / reading 47%, grade F, #618 of 1,170 statewide, top 56%, 1,498 students, 61% FRL) — zoned schools average 73% FRL vs 37% district-wide (36 pts higher); higher-poverty schools than district average — tighter screening recommended.
- Zoned-school proficiency averages 21% at this address vs 40% district-wide (-20 pts) — the specific schools serving this property underperform the Mt. Diablo Unified average; the district grade overstates school quality for this exact location.
- Market conditions: Rents rising (+1.1%/yr); 271 active listings in the ZIP; 10 comparable units currently listed for rent nearby; rentals leasing fast (median 4d on market — plan ~1-2 weeks tenant-placement turnaround); solid renter incomes; 2,169 units permitted in Contra Costa County in 2024 (896 in 5+ unit buildings).
Forward outlook
- Local home prices are declining (-3.0%/yr); year-one equity from $761 of loan paydown is wiped out by about $3k of value loss. Plan a longer hold.
- Contra Costa County population projected at +26% by 2050 — long-run rental-demand tailwind backs the buy-and-hold thesis.
- At projected returns (-3.0% appreciation + 1.1% rent growth), your $31k cash investment doubles in ~3 years — after that, you're playing with house money.
Negotiation context
- It's been on market 57 days — a 3% lower offer ($107k) is reasonable based on typical stale-listing flexibility.
Risks & watch-outs
- Climate carrying-cost: major wildfire risk; extreme-heat days projected 7→14/yr by 2055 (HVAC capex compounding) — expect insurance premiums to compound above CPI over the hold.
Questions for the listing agent
- It's been on market 57 days. Have you received any prior offers? Is the seller open to a 3% concession, seller financing, or rate buy-down credit?
- Is there a deadline driving the sale (1031 exchange, divorce, estate, relocation)? That informs how much negotiation room exists.
- Schools are F-rated, which usually means shorter tenancies and higher turnover. Who's the typical renter profile here, and what's been the actual vacancy rate?
- Crime grade is F in this area — have there been break-ins, vandalism, or insurance claims at this property in the last 3 years? What carrier currently insures it and at what premium?
- What's the average days-on-market for RENTAL listings here right now (not sales)? A rising rental-DOM trend means longer vacancies and softer asking-rent achievability than the comps imply.
- What's the recent tenant-quality profile in this submarket — average credit score on applications, eviction rate, late-payment / NSF rate, and stable-employment percentage? A property-management company in the area should have these aggregated.
- How much new for-sale + rental construction is in the pipeline within 1–3 miles? Heavy new supply typically softens prices + rents 12–24 months out; constrained supply supports both.
Investment metrics
- 1% rule
- 2.11% ✓
- Cap rate
- 18.03%
- Cash-on-cash
- 41.92%
- DSCR
- 2.87
- GRM
- 3.9
CMA / ARV
- ARV (on-the-fly)
- $207,432
- Comps found
- 6
Show comp detail 6 sales within ~0.75 mi
| Address | Dist | Beds/Ba | Sqft | Sold | Price | $/sf | Match |
|---|---|---|---|---|---|---|---|
| 55 Pacifica Ave #96 | 0.00mi | 2/2.0 | 960 (-7%) | 10mo | $138,500 | $144 | 80 |
| 55 Pacifica Ave #103 | 0.01mi | 3/2.0 (+1) | 1,092 (+6%) | 14mo | $220,000 | $201 | 73 |
| 55 Pacifica Ave #110 | 0.08mi | 3/1.0 (+1) | 920 (-11%) | 6mo | $132,000 | $143 | 64 |
| 728 Treasure Dr | 0.50mi | 2/2.0 | 1,040 (+1%) | 14mo | $127,000 | $122 | 63 |
| 3777 Willow Pass Rd #30 | 0.63mi | 3/2.0 (+1) | 921 (-11%) | 7mo | $239,000 | $260 | 42 |
| 617 Bounty Dr | 0.57mi | 3/2.0 (+1) | 909 (-12%) | 14mo | $215,000 | $237 | 37 |
Match score weights: distance 35% · size 25% · config 20% · recency 20%. Top-matched comps best support the ARV.
Projected returns pro-forma
-3.0% appreciation · 1.11% rent growth · sell at horizon
- IRR
- 36.4%
- Equity multiple
- 2.51×
- Total profit
- $46,400
- Equity at exit
- $16,401
- IRR
- 42.1%
- Equity multiple
- 4.62×
- Total profit
- $111,649
- Equity at exit
- $9,511
Cash invested: $30,800 (down + closing). Projections, not guarantees.
Landlord ↔ Tenant lean methodology
- Overall (STATE)
- 18 Strongly Tenant-Friendly
- State California
- 18 Strongly Tenant-Friendly · D+13
- County
- — inherits STATE
- City
- — inherits STATE
ZIP-level market 94565
- Rents YoY
- 1.1%
- Active inventory
- 271
- Price-to-rent
- 3.9×
Monthly cashflow live
- Estimated rent
- $2,324 high interval (Pro) →
- Mortgage (P&I)
- −$577
- Tax est. 1.5%
- −$138 /mo · $1,650/yr
- Insurance
- −$46
- HOA
- −$0
- Vacancy / Maint / Mgmt
- −$488
- Net cashflow
- $1,076
Break-even live
Sensitivity live
| Price | -10% $1,152 | -5% $1,114 | +0% $1,076 | +5% $1,038 | +10% $1,000 |
|---|---|---|---|---|---|
| Rent | -10% $892 | -5% $984 | +0% $1,076 | +5% $1,168 | +10% $1,260 |
| Rate | -1.0pp $1,131 | -0.5pp $1,104 | base $1,076 | +0.5pp $1,047 | +1.0pp $1,018 |
UW: 25.0% down · 7.5% · 30yr · 1.5% tax · 5.0% vac · 8.0% maint · 8.0% mgmt
Financing live
Cash to close
- Down payment
- $27,500
- Closing costs
- $3,300
- Reserves months
- —
- Total cash needed
- —
Loan-product check · same deal, 3 products live
Conventional
25% down · 7.5% · 30yr
- Down + closing
- —
- Monthly P&I
- —
- Monthly cashflow
- —
- DSCR
- —
- Eligible?
- —
Personal DTI + credit; lowest rate.
DSCR
20% down · 8.5% · 30yr
- Down + closing
- —
- Monthly P&I
- —
- Monthly cashflow
- —
- DSCR
- —
- Eligible?
- —
No personal income docs; deal must DSCR.
Hard money
10% down · 12.0% · 12mo
- Down + closing
- —
- Monthly P&I
- —
- Monthly cashflow
- —
- DSCR
- —
- Eligible?
- —
Short-term bridge; refi at stabilization.
Rent comps 10 comps
| Address | Beds | Baths | Sqft | Rent | $/sqft | DOM | Units | Dist |
|---|---|---|---|---|---|---|---|---|
| 60 Pacifica Ave Bay Point, CA | 2.0 | 1.5 | 864 | $1,775 | $2.05 | 25d | 1 | 0.17mi |
| 1123 Shoreview Ct Bay Point, CA | 1.0–3.0 | 1.0–2.0 | 824 | $2,417 | $2.93 | 4d | 9 | 0.44mi |
| 139 Ambrose Ave Bay Point, CA | 3.0 | 2.0 | 1400 | $3,000 | $2.14 | 22d | 1 | 0.78mi |
| 138 Tammy Cir Bay Point, CA | 2.0 | 1.0 | 842 | $2,300 | $2.73 | 4d | 1 | 0.79mi |
| 2000 Villa Dr Pittsburg, CA | 1.0–2.0 | 1.0–2.0 | 924 | $2,890 | $3.13 | 3d | 13 | 0.83mi |
| 3166 Winterbrook Dr Bay Point, CA | 3.0 | 2.0 | 1150 | $3,000 | $2.61 | 0d | 1 | 0.94mi |
| 2901 Mary Ann Ln Bay Point, CA | 1.0–2.0 | 1.0–2.0 | 745 | $2,172 | $2.92 | 0d | 8 | 1.16mi |
| 515 Lancaster Ln #138 Bay Point, CA | 2.0 | 2.0 | 884 | $2,600 | $2.94 | 25d | 1 | 1.17mi |
| 1023 Chadwick Cir Bay Point, CA | 2.0 | 2.0 | 940 | $2,350 | $2.50 | 6d | 1 | 1.20mi |
| 135 Poinsettia Ave Bay Point, CA | 3.0 | 1.0 | 1169 | $2,700 | $2.31 | 0d | 1 | 1.26mi |
Listing history 10 events
-
2026-06-21days on market $110,000 Active 57 DOM
-
2026-06-18days on market $110,000 Active 54 DOM
-
2026-06-17days on market $110,000 Active 53 DOM
-
2026-06-16days on market $110,000 Active 52 DOM
-
2026-06-15days on market $110,000 Active 51 DOM
-
2026-06-13days on market $110,000 Active 49 DOM
-
2026-06-13pricedays on market $110,000 Active 48 DOM
-
2026-06-10days on market $140,000 Active 45 DOM
-
2026-06-08days on market $140,000 Active 44 DOM
-
2026-06-07statusdays on market $140,000 Active 43 DOM
ⓘ Source: listings_history table (triggers on properties + properties_extension) + one-shot
backfill from property_details.listing_events for pre-trigger history.
Climate risk First Street
- Flood 1/10 Low FEMA zone X (unshaded) · 0% chance over 30 yrs
- Wildfire 6/10 Major
- Heat 5/10 Major 7 d/yr ≥98°F today · 14 d/yr by 30 yrs out
- Wind 1/10 Low
- Air quality 9/10 Extreme 18 unhealthy d/yr today · 19 by 30 yrs out
Nearby sold comps map
Loading sold comps map…
Walkable amenities ~0.75 mi
Loading nearby amenities…
Taxation est. · year 1
- Rental income
- $27,891
- − Mortgage interest
- −$6,162
- − Property taxes
- −$1,650
- − Insurance
- −$550
- − Repairs & maintenance
- −$2,231
- − Management
- −$2,231
- − Depreciation
- −$3,200
- Taxable income
- $11,867
- Est. tax owed @ 24.0%
- −$2,848
- After-tax cash flow
- $10,064/yr
For passive investors: Depreciation is non-cash, so a rental often shows a tax loss while cash-flowing — sheltering income. Rental losses are passive: they offset passive income freely, and up to $25,000/yr can offset ordinary (W-2) income if you actively participate and your MAGI is under $100k (phasing out to $0 by $150k); unused losses carry forward. On sale, claimed depreciation is recaptured at up to 25%, and gains may owe capital-gains tax (a 1031 exchange can defer both). Figures are a year-1 estimate at your 24.0% rate — not tax advice; consult a CPA.
Schools (NCES district)
- District
- Mt. Diablo Unified
- NCES district ID
- 0626370
- Math proficiency
- 36% ▼ -2.00%
- Reading proficiency
- 45% ▼ -5.00%
- Median HH income
- $77,494
- Composite
- 37.5/100
- National rank
- #4401
- State rank
- #202 of 517 in CA
Livability — Bay Point
- Score
- 57/100
- State rank
- #736
- US rank
- #21661
Category grades
Schools grade is shown separately in the Schools card above.
Census & demographics
- Census place
- Bay Point, CA
- County
- Contra Costa County · 1,059,880 people
- Metro
- San Francisco-Oakland-Berkeley, CA
- Population (ZIP)
- 100,488
- Household income
- $95,556
- Rent vs Own
- Severe rent burden
- 3942.0
Population outlook (Contra Costa County) Hauer SSP2
- Today (2025)
- 1,287,720 people
- By 2030
- 1,364,937 · +6.0%
- By 2040
- 1,506,209 · +17.0%
- By 2050
- 1,624,373 · +26.1%
- By 2075
- 1,853,193 · +43.9%
- By 2100
- 1,901,231 · +47.6%
Race, ethnicity, and origin ACS 2023
- Neighborhood character
- Diverse neighborhood (Simpson 0.70)
- Race & ethnicity
- Hispanic / Latino 48% Two or more races 19% Asian 17% White 16% Black 13% Pacific Islander 1% Native American 1%
- Hispanic origin (detail)
- Mexican 38% Puerto Rican 1%
- Common ancestry
- Italian 1% Russian 1% Lithuanian 1%
- Foreign-born
- 34% · Canada, China, Vietnam
- Languages at home
- 47% English-only · Spanish 37% Tagalog/Filipino 6% Other Indo-European 4%
Political lean MEDSL · Contra Costa
- 2024 margin
- Solid D (+38.0) · D 67.3% · R 29.4% · Other 3.3%
- 2008→2024 swing
- +0.2pp no change · 2008: 37.8pp · 2024: 38.0pp
- All cycles
- 2024: D+38.0 2020: D+45.3 2016: D+43.5 2012: D+33.7 2008: D+37.8
Not yet ingested
- Civics
- —
Market trends
- HPI YoY
- ▼ -478.40%
- Current HPI
- 376.2576
- Rent YoY
- ▲ 1.11%
- Metro
- San Francisco-Oakland-Berkeley, CA
- State GDP YoY
- ▲ 3.21%
- F500 in state
- 116
Industry mix (Fortune 500 HQ in CA)
| Industry | F500 HQs | Revenue |
|---|---|---|
| Technology | 27 | $1,492B |
|
||
| Financial Services | 3 | $174B |
|
||
| Retail | 3 | $44B |
|
||
| Insurance | 3 | $26B |
|
||
| Media / Entertainment | 2 | $115B |
|
||
| Pharmaceuticals / Biotech | 2 | $62B |
|
||
Property tax history
-0.8%/yrLatest (2025): $138 · +1.1% YoY. Source: county tax records.
Cash-flow waterfall
monthlySold comps — $/sqft
last 12 mo · ≤1 miLoading sold comps…