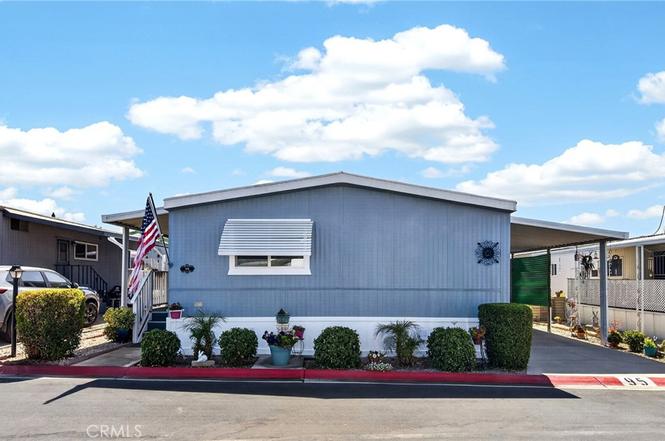
2727 Pacific #95
San Bernardino, CA 92346
$224,000F
2 bd · 2.0 ba ·
960 sqft ·
Built 1980
· Manufactured
· Active
· 5 DOM
Cashflow @ list (25.0% down · 7.5%)
Estimated rent
$1,554/mo
Mortgage (P&I)
−$1,175
Tax + insurance
−$373
HOA
−$0
Vac / Maint / Mgmt
−$326
Net cashflow
$-320/mo
Annual
$-3,845/yr
Cap rate
4.58%
Cash-on-cash
-6.13%
DSCR
0.73
1% rule
0.69%
Cash to close
$62,720
Investor read
- This is a 2-bed/2.0-bath manufactured listed at $224k.
- At list price, monthly cash flow is $-320 ($-4k/yr) — negative.
- To cash-flow at today's rent, offer at most $178k (20.7% below list).
- To meet the 1% rule (rent ≥ 1% of price), the offer needs to be $155k (30.6% below list).
- Only 5 days on market — expect competitive offers; lowballing is unlikely to land.
- Recommended offer: $155k (30.6% below list) — sets the bar for 1% rule.
- Local home prices are declining (-3.0%/yr); year-one equity from $2k of loan paydown is wiped out by about $7k of value loss. Plan a longer hold.
- Location reads 59/100 on livability (#661 in CA) — a working-class tenant base; expect higher turnover. Strengths: commute A+, housing A; Watch: employment D, crime F, cost of living F.
- San Bernardino City Unified (urban): math 27% / reading 40% proficiency, ranked #959 of 1,400 in CA (top 68%) — families likely to look elsewhere, expect single-tenant / working-renter base with shorter leases; 81% free/reduced lunch — lower-income household profile, screen leases tightly.
- Zoned schools: Emmerton Elementary (502 students, 91% FRL); Colonel Joseph C. Rodriguez Prep Academy (739 students, 87% FRL); San Gorgonio High (1,542 students, 88% FRL).
- Market conditions: Rents rising (+2.9%/yr); 150 active listings in the ZIP; 31 comparable units currently listed for rent nearby; rentals at typical pace (median 27d on market — plan ~3-4 weeks tenant-placement turnaround); solid renter incomes; 5,458 units permitted in San Bernardino County in 2024 (1,500 in 5+ unit buildings).
- San Bernardino County population projected at +15% by 2050 — modest demand growth; plan on rents tracking national, not racing it.
- Climate carrying-cost: major flood risk; extreme-heat days projected 6→16/yr by 2055 (HVAC capex compounding) — expect insurance premiums to compound above CPI over the hold.
- Cap rate 4.6% vs local median 3.5% in San Bernardino — top-decile yield for the area; either an underpriced asset or a hidden risk that comps aren't pricing in. Stress-test before assuming the spread holds.
Questions for listing agent
- What do current leases actually rent for vs. the listed asking? Can we see a recent rent roll and the last 12 months of T-12 income?
- Is there a deadline driving the sale (1031 exchange, divorce, estate, relocation)? That informs how much negotiation room exists.
- Schools are D-rated, which usually means shorter tenancies and higher turnover. Who's the typical renter profile here, and what's been the actual vacancy rate?
- Crime grade is F in this area — have there been break-ins, vandalism, or insurance claims at this property in the last 3 years? What carrier currently insures it and at what premium?
- The area grade is low — what's the realistic commute time and amenity access for the typical tenant pool here? Any planned neighborhood developments (good or bad) we should know about?
- What's the average days-on-market for RENTAL listings here right now (not sales)? A rising rental-DOM trend means longer vacancies and softer asking-rent achievability than the comps imply.
- What's the recent tenant-quality profile in this submarket — average credit score on applications, eviction rate, late-payment / NSF rate, and stable-employment percentage? A property-management company in the area should have these aggregated.
- How much new for-sale + rental construction is in the pipeline within 1–3 miles? Heavy new supply typically softens prices + rents 12–24 months out; constrained supply supports both.
CashFlowRE · CFR-6CEHHK7C8FHYZ3
· Data 1 h ago
cashflowre.app · 2026-05-29