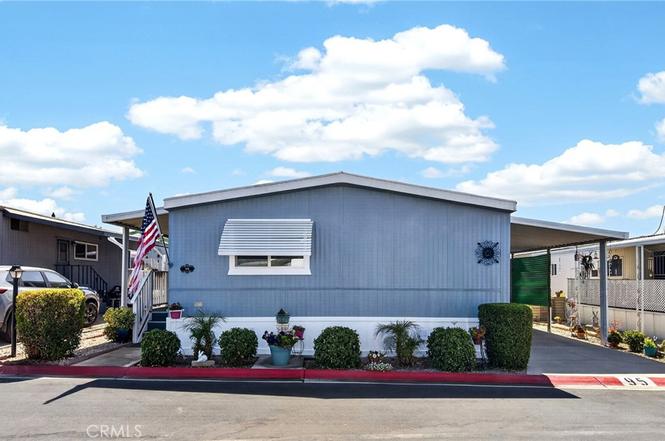
2727 Pacific #95 · San Bernardino, CA
Flood risk 6/10 · Moderate
- FEMA flood zone
- X (shaded)
- Chance of flooding over 30 yrs
- 0.75%
- Est. flood insurance / yr
- $507 – $1,088
Fire risk 4/10 · Minor
- Est. fire insurance / yr
- $659 – $1,223
Heat risk 8/10 · Major
- Hot days now (above 101°F)
- 6 days/yr
- Hot days in 30 yrs
- 16 days/yr
Wind risk 1/10 · Minimal
- Chance of severe wind over 30 yrs
- —
Air-quality risk 10/10 · Severe
- Unhealthy air days now
- 29 days/yr
- Unhealthy air days in 30 yrs
- 35 days/yr
Risk factors via First Street. Map © Google.
Why this score? — see what drove the D grade
The composite is a weighted blend of 9 inputs, each scored 0–100. Each bar is that input's sub-score; the figure is the points it added to the 100-point composite (weight × sub-score).
- Cash flow +14.4/30.0
- ARV discount +7.5/15.0
- DSCR +4.4/10.0
- 1% rule +4.0/10.0
- Rent growth +3.2/5.0
- Schools +3.1/10.0
- Livability +3.0/5.0
- Condition / age +2.5/5.0
- Appreciation +0.0/10.0
$224,000
🖨 Deal sheet (PDF) 📄 Offer letter ✓ Due diligence
Listing remarks
Beautifully upgraded and move-in ready! A rare opportunity in this all age park. This stunning 2-bedroom, 2-bath home offers comfort and style. Pride of ownership is evident in every detail from the beautifully remodeled kitchen and bathrooms to the back yard. This home has been thoughtfully updated with numerous upgrades, creating a bright and inviting space you'll love coming home to. The layout provides plenty of room for everyday living and entertaining with the addition of a modern touch. The list of upgrades is endless! New flooring, drywall, ceiling fans and lighting, new heating and AC and a tankless water heater. All new appliances included! New toilets, cabinets and counter-tops
Key facts
- New toilets
- Remodeled kitchen
- New flooring
Tags
Property features AI
Finance
- Other: Property is a single unit within a larger community; Parcel number: 1191231386095
- HOA & community: Land lease community (monthly land lease); Land lease amount: $535.88 monthly; 165 units in the community; Urban community features
Exterior
- Parking: Attached carport; Has parking
- Utilities: Public sewer; District/public water; Natural gas connected; Electricity connected; Sewer connected; Water connected
- Home design: Manufactured house; Attached property with 2+ common walls; Single-story; Has a view; Entry level: 1
- Construction: Drywall walls; Certified 433-A: No
- Exterior features: Front porch; Awning; Vinyl fencing; Porch facing front; In-ground private and community pool access; Close to clubhouse; Garden
Interior
- Kitchen: Remodeled kitchen with granite counters; Gas range; Microwave; Refrigerator; Tankless water heater
- Bedrooms: 2 bedrooms on the main level (including primary bedroom)
- Flooring: Vinyl flooring
- Bathrooms: 2 main level bathrooms (includes full and 3/4); Upgraded bathrooms with quartz counters, remodeled finishes, bathtub and walk-in shower
- Heating & cooling: Heat pump (ductless) heating and cooling
- Interior features: Ceiling fan; Recessed lighting; Granite counters; Double pane windows with blinds and screens; One-level home; entry at front/carport; Turnkey condition
- Laundry & utility: Inside laundry; Washer and dryer included; Washer hookup and gas dryer hookup
Neighborhood map
What this means for you Summary
Snapshot
- This is a 2-bed/2.0-bath manufactured listed at $224k.
Deal economics
- At list price, monthly cash flow is $46 ($555/yr) — positive.
- The deal already cash-flows at list — no discount required.
- To meet the 1% rule (rent ≥ 1% of price), the offer needs to be $202k (9.9% below list).
- Recommended offer: $202k (9.9% below list) — sets the bar for 1% rule.
- Cap rate 6.5% vs local median 3.5% in San Bernardino — top-decile yield for the area; either an underpriced asset or a hidden risk that comps aren't pricing in. Stress-test before assuming the spread holds.
Location & tenants
- Location reads 59/100 on livability (#661 in CA) — a working-class tenant base; expect higher turnover. Strengths: commute A+, housing A; Watch: employment D, crime F, cost of living F.
- San Bernardino City Unified (urban): math 27% / reading 40% proficiency, ranked #959 of 1,400 in CA (top 68%) — families likely to look elsewhere, expect single-tenant / working-renter base with shorter leases; 81% free/reduced lunch — lower-income household profile, screen leases tightly.
- Zoned schools: Emmerton Elementary (502 students, 91% FRL); Colonel Joseph C. Rodriguez Prep Academy (739 students, 87% FRL); San Gorgonio High (1,542 students, 88% FRL).
- Market conditions: Rents rising (+2.9%/yr); 152 active listings in the ZIP; 31 comparable units currently listed for rent nearby; rentals at typical pace (median 27d on market — plan ~3-4 weeks tenant-placement turnaround); solid renter incomes; 5,458 units permitted in San Bernardino County in 2024 (1,500 in 5+ unit buildings).
Forward outlook
- Local home prices are declining (-3.0%/yr); year-one equity from $2k of loan paydown is wiped out by about $7k of value loss. Plan a longer hold.
- San Bernardino County population projected at +15% by 2050 — modest demand growth; plan on rents tracking national, not racing it.
Negotiation context
- Only 4 days on market — expect competitive offers; lowballing is unlikely to land.
Risks & watch-outs
- Climate carrying-cost: major flood risk; extreme-heat days projected 6→16/yr by 2055 (HVAC capex compounding) — expect insurance premiums to compound above CPI over the hold.
Questions for the listing agent
- Is there a deadline driving the sale (1031 exchange, divorce, estate, relocation)? That informs how much negotiation room exists.
- Schools are D-rated, which usually means shorter tenancies and higher turnover. Who's the typical renter profile here, and what's been the actual vacancy rate?
- Crime grade is F in this area — have there been break-ins, vandalism, or insurance claims at this property in the last 3 years? What carrier currently insures it and at what premium?
- The area grade is low — what's the realistic commute time and amenity access for the typical tenant pool here? Any planned neighborhood developments (good or bad) we should know about?
- What's the average days-on-market for RENTAL listings here right now (not sales)? A rising rental-DOM trend means longer vacancies and softer asking-rent achievability than the comps imply.
- What's the recent tenant-quality profile in this submarket — average credit score on applications, eviction rate, late-payment / NSF rate, and stable-employment percentage? A property-management company in the area should have these aggregated.
- How much new for-sale + rental construction is in the pipeline within 1–3 miles? Heavy new supply typically softens prices + rents 12–24 months out; constrained supply supports both.
Investment metrics
- 1% rule
- 0.90% ✗
- Cap rate
- 6.54%
- Cash-on-cash
- 0.88%
- DSCR
- 1.04
- GRM
- 9.2
CMA / ARV
- ARV (on-the-fly)
- $116,160
- Comps found
- 5
Show comp detail 5 sales within ~0.75 mi
| Address | Dist | Beds/Ba | Sqft | Sold | Price | $/sf | Match |
|---|---|---|---|---|---|---|---|
| 2727 Pacific St #78 | 0.00mi | 3/2.0 (+1) | 1,088 (+13%) | 4mo | $160,000 | $147 | 70 |
| 2692 Highland Ave #90 | 0.71mi | 2/2.0 | 1,080 (+12%) | 1mo | $88,000 | $81 | 45 |
| 26297 Baseline St #59 | 0.50mi | 2/2.0 | 828 (-14%) | 12mo | $100,000 | $121 | 44 |
| 26250 E 9th St #87 | 0.67mi | 3/1.0 (+1) | 1,000 (+4%) | 14mo | $111,000 | $111 | 42 |
| 26245 E Baseline St #58 | 0.55mi | 2/1.0 | 820 (-15%) | 21mo | $105,000 | $128 | 29 |
Match score weights: distance 35% · size 25% · config 20% · recency 20%. Top-matched comps best support the ARV.
Projected returns pro-forma
-3.0% appreciation · 2.91% rent growth · sell at horizon
- IRR
- -15.0%
- Equity multiple
- 0.47×
- Total profit
- $-33,506
- Equity at exit
- $33,399
- IRR
- -6.5%
- Equity multiple
- 0.59×
- Total profit
- $-26,010
- Equity at exit
- $19,367
Cash invested: $62,720 (down + closing). Projections, not guarantees.
Landlord ↔ Tenant lean methodology
- Overall (STATE)
- 18 Strongly Tenant-Friendly
- State California
- 18 Strongly Tenant-Friendly · D+13
- County
- — inherits STATE
- City
- — inherits STATE
ZIP-level market 92346
- Rents YoY
- 2.9%
- Active inventory
- 152
- Price-to-rent
- 9.2×
Monthly cashflow live
- Estimated rent
- $2,018 high interval (Pro) →
- Mortgage (P&I)
- −$1,175
- Tax est. 1.5%
- −$280 /mo · $3,360/yr
- Insurance
- −$93
- HOA
- −$0
- Vacancy / Maint / Mgmt
- −$424
- Net cashflow
- $46
Break-even live
Sensitivity live
| Price | -10% $201 | -5% $124 | +0% $46 | +5% $-31 | +10% $-109 |
|---|---|---|---|---|---|
| Rent | -10% $-113 | -5% $-33 | +0% $46 | +5% $126 | +10% $206 |
| Rate | -1.0pp $159 | -0.5pp $103 | base $46 | +0.5pp $-12 | +1.0pp $-71 |
UW: 25.0% down · 7.5% · 30yr · 1.5% tax · 5.0% vac · 8.0% maint · 8.0% mgmt
Financing live
Cash to close
- Down payment
- $56,000
- Closing costs
- $6,720
- Reserves months
- —
- Total cash needed
- —
Loan-product check · same deal, 3 products live
Conventional
25% down · 7.5% · 30yr
- Down + closing
- —
- Monthly P&I
- —
- Monthly cashflow
- —
- DSCR
- —
- Eligible?
- —
Personal DTI + credit; lowest rate.
DSCR
20% down · 8.5% · 30yr
- Down + closing
- —
- Monthly P&I
- —
- Monthly cashflow
- —
- DSCR
- —
- Eligible?
- —
No personal income docs; deal must DSCR.
Hard money
10% down · 12.0% · 12mo
- Down + closing
- —
- Monthly P&I
- —
- Monthly cashflow
- —
- DSCR
- —
- Eligible?
- —
Short-term bridge; refi at stabilization.
Rent comps 31 comps
| Address | Beds | Baths | Sqft | Rent | $/sqft | DOM | Units | Dist |
|---|---|---|---|---|---|---|---|---|
| 7221 Olive St Highland, CA | 2.0 | 1.0 | 866 | $2,150 | $2.48 | 45d | 1 | 0.44mi |
| 7410 San Francisco St Highland, CA | 2.0 | 2.0 | 864 | $2,500 | $2.89 | 26d | 1 | 0.50mi |
| 7410 San Francisco St Highland, CA | 2.0 | 2.0 | 864 | $2,400 | $2.78 | 22d | 1 | 0.50mi |
| 26030 E Baseline St San Bernardino, CA | 1.0–2.0 | 1.0 | 788 | $1,700 | $2.16 | 45d | 1 | 0.57mi |
| 6601 Victoria Ave Highland, CA | 2.0 | 2.0 | 775 | $1,677 | $2.16 | 22d | 1 | 0.59mi |
| 6601 Victoria Ave Highland, CA | 2.0 | 2.0 | 775 | $1,677 | $2.16 | 26d | 1 | 0.59mi |
| 6601 Victoria Ave Highland, CA | 2.0 | 2.0 | 775 | $1,827 | $2.36 | 45d | 1 | 0.59mi |
| 26660 9th St Highland, CA | 1.0–2.0 | 1.0–2.0 | 755 | $2,050 | $2.72 | 0d | 5 | 0.70mi |
| 25913 E Baseline St San Bernardino, CA | 2.0 | 1.0 | 950 | $1,675 | $1.76 | 45d | 1 | 0.71mi |
| 25863 Pacific St Unit 18 San Bernardino, CA | 1.0 | 1.0 | 900 | $1,495 | $1.66 | 45d | 1 | 0.71mi |
| 2169 Sunrise Ln E Unit A San Bernardino, CA | 3.0 | 2.0 | 1000 | $2,000 | $2.00 | 26d | 1 | 0.78mi |
| 25795 Walker St San Bernardino, CA | 3.0 | 1.0 | 878 | $2,350 | $2.68 | 14d | 1 | 0.83mi |
| 26026 9th St San Bernardino, CA | 2.0 | 1.0 | 850 | $1,900 | $2.24 | 26d | 1 | 0.85mi |
| 7239 Sterling Ave San Bernardino, CA | 2.0 | 1.0 | 600 | $1,750 | $2.92 | 20d | 1 | 0.91mi |
| 2225 Pumalo St San Bernardino, CA | 1.0–2.0 | 1.0–2.0 | 750 | $2,035 | $2.71 | 45d | 1 | 0.92mi |
| 27205 Main St Highland, CA | 1.0 | 1.0 | 700 | $1,575 | $2.25 | 45d | 1 | 0.97mi |
| 25941 9th St San Bernardino, CA | 2.0 | 1.0 | 950 | $1,700 | $1.79 | 5d | 1 | 0.99mi |
| 3404 20th St #1 Highland, CA | 2.0 | 1.0 | 780 | $2,195 | $2.81 | 5d | 1 | 1.02mi |
| 7767 Colwyn Ave Highland, CA | 3.0 | 1.5 | 1107 | $2,500 | $2.26 | 26d | 1 | 1.02mi |
| 3479 20th St Highland, CA | 2.0 | 1.0 | 882 | $1,995 | $2.26 | 1d | 1 | 1.08mi |
| 3479 20th St Highland, CA | 2.0 | 1.0 | 882 | $1,995 | $2.26 | 45d | 1 | 1.08mi |
| 3511 Rainbow Ln Highland, CA | 2.0 | 1.0 | 780 | $2,050 | $2.63 | 5d | 1 | 1.09mi |
| 6787 Cole Ave Highland, CA | 2.0–3.0 | 2.0 | 1005 | $2,125 | $2.11 | 0d | 1 | 1.09mi |
| 3495 21st St Unit B Highland, CA | 2.0 | 2.0 | 1000 | $2,000 | $2.00 | 45d | 1 | 1.12mi |
| 3532 Rainbow Ln Highland, CA | 2.0 | 1.0 | 882 | $2,100 | $2.38 | 1d | 1 | 1.12mi |
| 7862 Lankershim Ave Highland, CA | 2.0 | 1.0 | 800 | $1,675 | $2.09 | 45d | 1 | 1.13mi |
| 26674 Ward St Highland, CA | 1.0 | 1.0 | 720 | $1,432 | $1.99 | 14d | 1 | 1.17mi |
| 6985 Osbun Rd San Bernardino, CA | 3.0 | 1.0 | 900 | $2,500 | $2.78 | 45d | 1 | 1.17mi |
| 7205 Osbun Rd San Bernardino, CA | 3.0 | 1.0 | 1100 | $2,450 | $2.23 | 6d | 1 | 1.20mi |
| 7205 Osbun Rd San Bernardino, CA | 3.0 | 1.0 | 1100 | $2,450 | $2.23 | 1d | 1 | 1.20mi |
| 1775 E 20th St San Bernardino, CA | 1.0 | 1.0 | 650 | $1,595 | $2.45 | 1d | 1 | 1.33mi |
Listing history 3 events
-
2026-06-21days on market $224,000 Active 4 DOM
-
2026-06-17remarks 699-char remark
-
2026-06-17$224,000 Active 1 DOM
ⓘ Source: listings_history table (triggers on properties + properties_extension) + one-shot
backfill from property_details.listing_events for pre-trigger history.
Climate risk First Street
- Flood 6/10 Major FEMA zone X (shaded) · 75% chance over 30 yrs
- Wildfire 4/10 Moderate
- Heat 8/10 Severe 6 d/yr ≥101°F today · 16 d/yr by 30 yrs out
- Wind 1/10 Low
- Air quality 10/10 Extreme 29 unhealthy d/yr today · 35 by 30 yrs out
Nearby sold comps map
Loading sold comps map…
Walkable amenities ~0.75 mi
Loading nearby amenities…
Taxation est. · year 1
- Rental income
- $24,216
- − Mortgage interest
- −$12,547
- − Property taxes
- −$3,360
- − Insurance
- −$1,120
- − Repairs & maintenance
- −$1,937
- − Management
- −$1,937
- − Depreciation
- −$6,516
- Taxable loss
- −$3,202
- Est. tax savings @ 24.0%
- +$769
- After-tax cash flow
- $1,323/yr
For passive investors: Depreciation is non-cash, so a rental often shows a tax loss while cash-flowing — sheltering income. Rental losses are passive: they offset passive income freely, and up to $25,000/yr can offset ordinary (W-2) income if you actively participate and your MAGI is under $100k (phasing out to $0 by $150k); unused losses carry forward. On sale, claimed depreciation is recaptured at up to 25%, and gains may owe capital-gains tax (a 1031 exchange can defer both). Figures are a year-1 estimate at your 24.0% rate — not tax advice; consult a CPA.
Schools (NCES district)
- District
- San Bernardino City Unified
- NCES district ID
- 0634170
- Math proficiency
- 27% ▲ 1.00%
- Reading proficiency
- 40% ▬ 0.00%
- Median HH income
- $39,758
- Composite
- 30.8/100
- National rank
- #11385
- State rank
- #959 of 1400 in CA
Livability — San Bernardino
- Score
- 59/100
- State rank
- #661
- US rank
- #20479
Category grades
Schools grade is shown separately in the Schools card above.
Census & demographics
- Census place
- San Bernardino, CA
- County
- San Bernardino County · 2,030,291 people
- City population
- 255,614
- Metro
- Riverside-San Bernardino-Ontario, CA
- Population (ZIP)
- 56,179
- Household income
- $85,163
- Rent vs Own
- Severe rent burden
- 1816.0
Population outlook (San Bernardino County) Hauer SSP2
- Today (2025)
- 2,300,329 people
- By 2030
- 2,378,907 · +3.4%
- By 2040
- 2,523,137 · +9.7%
- By 2050
- 2,642,388 · +14.9%
- By 2075
- 2,880,769 · +25.2%
- By 2100
- 2,909,436 · +26.5%
Race, ethnicity, and origin ACS 2023
- Neighborhood character
- Diverse neighborhood (Simpson 0.63)
- Race & ethnicity
- Hispanic / Latino 53% White 26% Two or more races 14% Black 8% Asian 8% Native American 1%
- Hispanic origin (detail)
- Mexican 46%
- Common ancestry
- Italian 1% Iranian 1% Lithuanian 1%
- Foreign-born
- 19% · Canada, Vietnam, South Korea
- Languages at home
- 60% English-only · Spanish 32% Vietnamese 2% Tagalog/Filipino 2%
Political lean MEDSL · San Bernardino
- 2024 margin
- Toss-up / Even · D 47.5% · R 49.7% · Other 2.8%
- 2008→2024 swing
- -8.5pp toward R · 2008: 6.3pp · 2024: -2.1pp
- All cycles
- 2024: R+2.1 2020: D+10.7 2016: D+9.8 2012: D+5.4 2008: D+6.3
Not yet ingested
- Civics
- —
Market trends
- HPI YoY
- ▼ -328.00%
- Current HPI
- 367.2829
- Rent YoY
- ▲ 2.91%
- Metro
- Riverside-San Bernardino-Ontario, CA
- State GDP YoY
- ▲ 3.21%
- F500 in state
- 116
Industry mix (Fortune 500 HQ in CA)
| Industry | F500 HQs | Revenue |
|---|---|---|
| Technology | 27 | $1,492B |
|
||
| Financial Services | 3 | $174B |
|
||
| Retail | 3 | $44B |
|
||
| Insurance | 3 | $26B |
|
||
| Media / Entertainment | 2 | $115B |
|
||
| Pharmaceuticals / Biotech | 2 | $62B |
|
||
Price history
1 event — show timeline
- 2026-06-17 Listed $224,000 CRMLS
Property tax history
-7.2%/yrLatest (2025): $40 · +0.1% YoY. Source: county tax records.
Cash-flow waterfall
monthlySold comps — $/sqft
last 12 mo · ≤1 miLoading sold comps…