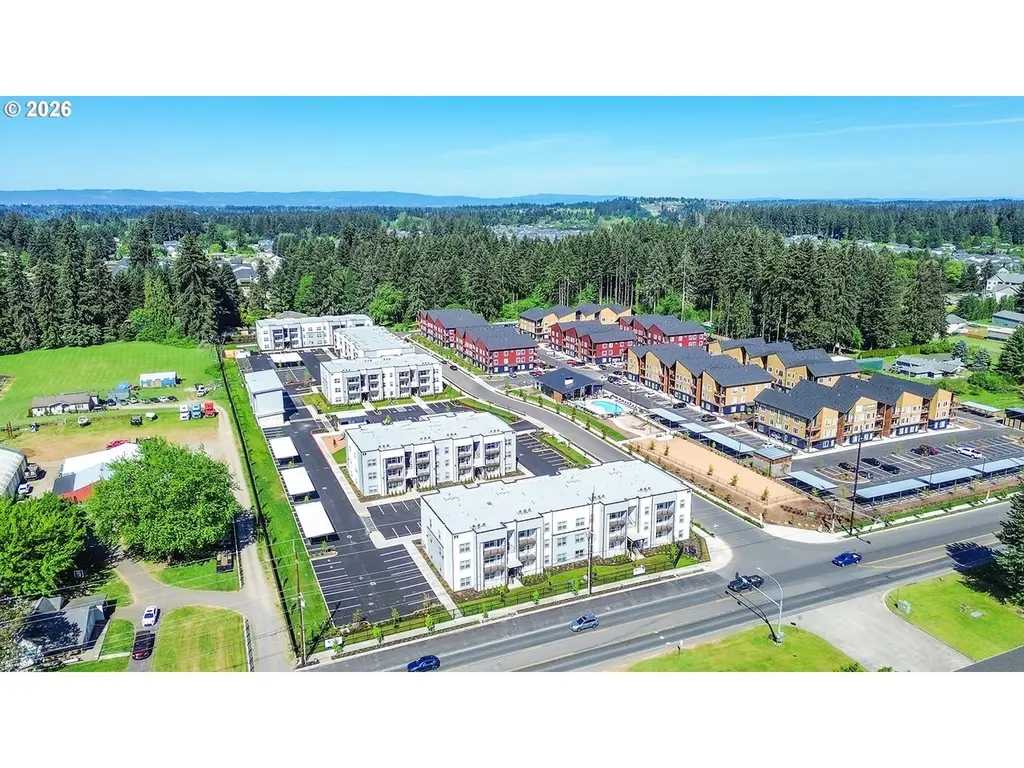
7011 NE 126th Ave
Barberton, WA 98686
$50,135,740B
None bd · 224.0 ba ·
1,850 sqft ·
Built 2026
· MultiFamily
· Active
· 24 DOM
Cashflow @ list (25.0% down · 7.5%)
Estimated rent
$902,200/mo
Mortgage (P&I)
−$262,917
Tax + insurance
−$83,560
HOA
−$0
Vac / Maint / Mgmt
−$189,462
Net cashflow
$366,261/mo
Annual
$4,395,134/yr
Cap rate
15.06%
Cash-on-cash
31.31%
DSCR
2.39
1% rule
1.80%
Cash to close
$14,038,007
Investor read
- This is a ?-bed/224.0-bath multifamily listed at $50.14M.
- At list price, monthly cash flow is $366k ($4.40M/yr) — positive.
- The deal already cash-flows at list — no discount required.
- Meets the 1% rule at list price ($902k rent vs $50.14M).
- It's been on market 24 days — a 2% lower offer ($49.38M) is reasonable based on typical stale-listing flexibility.
- Recommended offer: $49.38M (1.5% below list) — sets the bar for market timing.
- Local home prices are declining (-3.0%/yr); year-one equity from $347k of loan paydown is wiped out by about $1.50M of value loss. Plan a longer hold.
- Location reads 72/100 on livability (#223 in WA) — a middle-class / working-renter tenant base. Strengths: employment A+, housing A+, crime A-; Watch: amenities F, commute F, cost of living F.
- Battle Ground School District (suburban): math 48% / reading 60% proficiency, ranked #92 of 291 in WA (top 32%) — acceptable for families but not a draw, mixed tenant base, ~2y average lease.
- Zoned schools: Pleasant Valley Primary (556 students, 42% FRL); Pleasant Valley Middle (396 students, 45% FRL); Prairie High School (1,603 students, 41% FRL).
- Market conditions: Rents flat; 332 active listings in the ZIP; 14 comparable units currently listed for rent nearby; rentals at typical pace (median 26d on market — plan ~3-4 weeks tenant-placement turnaround); 43% of comp listings sitting > 30 days — soft ceiling on asking rent; solid renter incomes; 3,547 units permitted in Clark County in 2024 (1,361 in 5+ unit buildings).
- Clark County population projected at +29% by 2050 — long-run rental-demand tailwind backs the buy-and-hold thesis.
- At projected returns (-3.0% appreciation + 0.8% rent growth), your $14.04M cash investment doubles in ~5 years — after that, you're playing with house money.
- Cap rate 15.1% vs local median 2.5% in Barberton — top-decile yield for the area; either an underpriced asset or a hidden risk that comps aren't pricing in. Stress-test before assuming the spread holds.
- At $902,200/mo this rent would consume 10043% of the median local household income ($108k/yr) (locally 364% of renters already pay >50% of income on rent) — very limited rent-growth headroom before tenants either downsize or default.
Questions for listing agent
- Is there a deadline driving the sale (1031 exchange, divorce, estate, relocation)? That informs how much negotiation room exists.
- Schools are D-rated, which usually means shorter tenancies and higher turnover. Who's the typical renter profile here, and what's been the actual vacancy rate?
- What's the average days-on-market for RENTAL listings here right now (not sales)? A rising rental-DOM trend means longer vacancies and softer asking-rent achievability than the comps imply.
- What's the recent tenant-quality profile in this submarket — average credit score on applications, eviction rate, late-payment / NSF rate, and stable-employment percentage? A property-management company in the area should have these aggregated.
- How much new apartment / multifamily construction is in the pipeline within 1–3 miles? Heavy new supply (>2% of stock underway) typically softens rents 12–24 months out; light construction supports rent growth.
CashFlowRE · CFR-6E5R1E5T1DAQJ1
· Data 23 h ago
cashflowre.app · 2026-05-29