 🏗️ New Construction
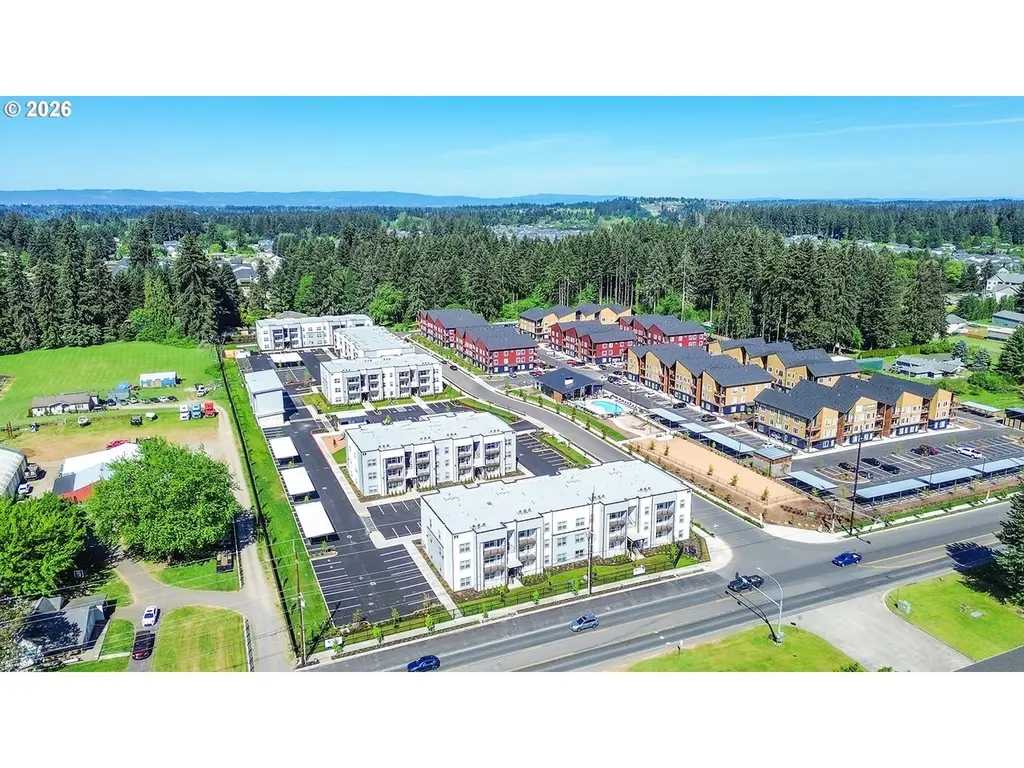
7011 NE 126th Ave · Barberton, WA
Flood risk 1/10 · Minimal
- FEMA flood zone
- X (unshaded)
- Chance of flooding over 30 yrs
- 0.0%
- Est. flood insurance / yr
- $507 – $1,088
Fire risk 4/10 · Minor
- Est. fire insurance / yr
- $604 – $1,122
Heat risk 3/10 · Minor
- Hot days now (above 91°F)
- 7 days/yr
- Hot days in 30 yrs
- 15 days/yr
Wind risk 1/10 · Minimal
- Chance of severe wind over 30 yrs
- —
Air-quality risk 9/10 · Severe
- Unhealthy air days now
- 15 days/yr
- Unhealthy air days in 30 yrs
- 15 days/yr
Risk factors via First Street. Map © Google.
Why this score? — see what drove the B grade
The composite is a weighted blend of 9 inputs, each scored 0–100. Each bar is that input's sub-score; the figure is the points it added to the 100-point composite (weight × sub-score).
- Cash flow +30.0/30.0
- 1% rule +10.0/10.0
- DSCR +10.0/10.0
- ARV discount +7.5/15.0
- Schools +5.0/10.0
- Livability +3.6/5.0
- Rent growth +2.7/5.0
- Condition / age +2.5/5.0
- Appreciation +0.0/10.0
$50,135,740
🖨 Deal sheet (PDF) 📄 Offer letter ✓ Due diligence
Multi-family units
County records classify this as Multi-Family (5+ Unit). Listing-text estimate: 1 unit. estimate disagrees with records
5+ unit building — per-unit beds/baths from public records are typically unavailable; the breakdown below (if shown) is an estimate from the listing text.
Listing remarks
New Construction Multi-Family Investment Opportunity. Completed in May 2026, this newly developed community features 136 thoughtfully designed residential units with a diverse mix of one-, two-, and three-bedroom floor plans. Each unit offers modern finishes and high-quality amenities, including open-concept layouts, high ceilings, stainless steel appliances, in-unit washers and dryers, private patios or balconies, carports, garages, and additional storage options. Community features pool, sundeck, gym, dog par & play area. The property is ideally situated directly across from the newly opened Curtain Creek Park, providing residents with immediate access to outdoor recreation and area
Key facts
- New construction
- Open-concept layouts
- Modern finishes
Tags
Property features AI
Finance
- Financial info: 136 total units; Unit rent examples: 3-bed (~$2,550), 2-bed plans (~$2,220–$2,300–$2,250), 1-bed (~$1,920); Unit counts by type: 3-bed: 12 units; 2-bed types: 12, 24, 36, and 4 units across different floorplans; 1-bed: 48 units
- HOA & community: Community landscaping included; On-site gym; Community pool; Zoned R-30
Exterior
- Parking: 204 total parking spaces; 6 garage spaces
- Security: Owned security system
- Utilities: Electric fuel; Public water; Public sewer; Cable and fiber internet
- Home design: Multi-family property; New construction (2026)
- Construction: Built in 2026
- Exterior features: Flat roof; Other exterior finish; Mountain views; Level lot; Paved road access
Interior
- Kitchen: Refrigerator; Range; Dishwasher; Disposal; Microwave
- Bedrooms: Unit mix includes 3-bed, 2-bed, and 1-bed units across multiple floorplans
- Bathrooms: Units with 1 and 2 bathrooms depending on floorplan
- Heating & cooling: Mini split heating; Wall unit cooling; Electric hot water
- Interior features: Attached storage
- Laundry & utility: Washer/Dryer in many units
Neighborhood map
What this means for you Summary
Snapshot
- This is a ?-bed/224.0-bath multifamily listed at $50.14M.
Deal economics
- At list price, monthly cash flow is $366k ($4.40M/yr) — positive.
- The deal already cash-flows at list — no discount required.
- Meets the 1% rule at list price ($902k rent vs $50.14M).
- Recommended offer: $49.38M (1.5% below list) — sets the bar for market timing.
- Cap rate 15.1% vs local median 2.5% in Barberton — top-decile yield for the area; either an underpriced asset or a hidden risk that comps aren't pricing in. Stress-test before assuming the spread holds.
Location & tenants
- Location reads 72/100 on livability (#223 in WA) — a middle-class / working-renter tenant base. Strengths: employment A+, housing A+, crime A-; Watch: amenities F, commute F, cost of living F.
- Battle Ground School District (suburban): math 48% / reading 60% proficiency, ranked #92 of 291 in WA (top 32%) — acceptable for families but not a draw, mixed tenant base, ~2y average lease.
- Zoned schools: Pleasant Valley Primary (556 students, 42% FRL); Pleasant Valley Middle (396 students, 45% FRL); Prairie High School (1,603 students, 41% FRL).
- Market conditions: Rents flat; 332 active listings in the ZIP; 14 comparable units currently listed for rent nearby; rentals at typical pace (median 25d on market — plan ~3-4 weeks tenant-placement turnaround); 43% of comp listings sitting > 30 days — soft ceiling on asking rent; solid renter incomes; 3,547 units permitted in Clark County in 2024 (1,361 in 5+ unit buildings).
- At $902,200/mo this rent would consume 10043% of the median local household income ($108k/yr) (locally 364% of renters already pay >50% of income on rent) — very limited rent-growth headroom before tenants either downsize or default.
Forward outlook
- Local home prices are declining (-3.0%/yr); year-one equity from $347k of loan paydown is wiped out by about $1.50M of value loss. Plan a longer hold.
- Clark County population projected at +29% by 2050 — long-run rental-demand tailwind backs the buy-and-hold thesis.
- At projected returns (-3.0% appreciation + 0.8% rent growth), your $14.04M cash investment doubles in ~5 years — after that, you're playing with house money.
Negotiation context
- It's been on market 24 days — a 2% lower offer ($49.38M) is reasonable based on typical stale-listing flexibility.
Questions for the listing agent
- Is there a deadline driving the sale (1031 exchange, divorce, estate, relocation)? That informs how much negotiation room exists.
- Schools are D-rated, which usually means shorter tenancies and higher turnover. Who's the typical renter profile here, and what's been the actual vacancy rate?
- What's the average days-on-market for RENTAL listings here right now (not sales)? A rising rental-DOM trend means longer vacancies and softer asking-rent achievability than the comps imply.
- What's the recent tenant-quality profile in this submarket — average credit score on applications, eviction rate, late-payment / NSF rate, and stable-employment percentage? A property-management company in the area should have these aggregated.
- How much new apartment / multifamily construction is in the pipeline within 1–3 miles? Heavy new supply (>2% of stock underway) typically softens rents 12–24 months out; light construction supports rent growth.
Investment metrics
- 1% rule
- 1.80% ✓
- Cap rate
- 15.06%
- Cash-on-cash
- 31.31%
- DSCR
- 2.39
- GRM
- 4.6
CMA / ARV
No comps found within radius.
Projected returns pro-forma
-3.0% appreciation · 0.78% rent growth · sell at horizon
- IRR
- 23.6%
- Equity multiple
- 1.94×
- Total profit
- $13,245,190
- Equity at exit
- $7,475,402
- IRR
- 30.1%
- Equity multiple
- 3.41×
- Total profit
- $33,888,583
- Equity at exit
- $4,334,822
Cash invested: $14,038,007 (down + closing). Projections, not guarantees.
Landlord ↔ Tenant lean methodology
- Overall (STATE)
- 28 Tenant-Leaning
- State Washington
- 28 Tenant-Leaning · D+8
- County
- — inherits STATE
- City
- — inherits STATE
ZIP-level market 98686
- Rents YoY
- 0.8%
- Active inventory
- 332
- Price-to-rent
- 2366.6×
Monthly cashflow live
- Estimated rent
- $902,200 high interval (Pro) →
- Mortgage (P&I)
- −$262,917
- Tax est. 1.5%
- −$62,670 /mo · $752,036/yr
- Insurance
- −$20,890
- HOA
- −$0
- Vacancy / Maint / Mgmt
- −$189,462
- Net cashflow
- $366,261
Break-even live
Sensitivity live
| Price | -10% $400,909 | -5% $383,585 | +0% $366,261 | +5% $348,937 | +10% $331,613 |
|---|---|---|---|---|---|
| Rent | -10% $294,987 | -5% $330,624 | +0% $366,261 | +5% $401,898 | +10% $437,535 |
| Rate | -1.0pp $391,509 | -0.5pp $379,013 | base $366,261 | +0.5pp $353,270 | +1.0pp $340,053 |
408-unit breakdown (identical units grouped — click to expand)
| Units | Beds | Baths | Est. rent |
|---|---|---|---|
| 136× units | 1 | 1 | $240,040 |
| #1 | 1 | 1 | $1,765 |
| #2 | 1 | 1 | $1,765 |
| #3 | 1 | 1 | $1,765 |
| #4 | 1 | 1 | $1,765 |
| #5 | 1 | 1 | $1,765 |
| #6 | 1 | 1 | $1,765 |
| #7 | 1 | 1 | $1,765 |
| #8 | 1 | 1 | $1,765 |
| #9 | 1 | 1 | $1,765 |
| #10 | 1 | 1 | $1,765 |
| #11 | 1 | 1 | $1,765 |
| #12 | 1 | 1 | $1,765 |
| #13 | 1 | 1 | $1,765 |
| #14 | 1 | 1 | $1,765 |
| #15 | 1 | 1 | $1,765 |
| #16 | 1 | 1 | $1,765 |
| #17 | 1 | 1 | $1,765 |
| #18 | 1 | 1 | $1,765 |
| #19 | 1 | 1 | $1,765 |
| #20 | 1 | 1 | $1,765 |
| #21 | 1 | 1 | $1,765 |
| #22 | 1 | 1 | $1,765 |
| #23 | 1 | 1 | $1,765 |
| #24 | 1 | 1 | $1,765 |
| #25 | 1 | 1 | $1,765 |
| #26 | 1 | 1 | $1,765 |
| #27 | 1 | 1 | $1,765 |
| #28 | 1 | 1 | $1,765 |
| #29 | 1 | 1 | $1,765 |
| #30 | 1 | 1 | $1,765 |
| #31 | 1 | 1 | $1,765 |
| #32 | 1 | 1 | $1,765 |
| #33 | 1 | 1 | $1,765 |
| #34 | 1 | 1 | $1,765 |
| #35 | 1 | 1 | $1,765 |
| #36 | 1 | 1 | $1,765 |
| #37 | 1 | 1 | $1,765 |
| #38 | 1 | 1 | $1,765 |
| #39 | 1 | 1 | $1,765 |
| #40 | 1 | 1 | $1,765 |
| #41 | 1 | 1 | $1,765 |
| #42 | 1 | 1 | $1,765 |
| #43 | 1 | 1 | $1,765 |
| #44 | 1 | 1 | $1,765 |
| #45 | 1 | 1 | $1,765 |
| #46 | 1 | 1 | $1,765 |
| #47 | 1 | 1 | $1,765 |
| #48 | 1 | 1 | $1,765 |
| #49 | 1 | 1 | $1,765 |
| #50 | 1 | 1 | $1,765 |
| #51 | 1 | 1 | $1,765 |
| #52 | 1 | 1 | $1,765 |
| #53 | 1 | 1 | $1,765 |
| #54 | 1 | 1 | $1,765 |
| #55 | 1 | 1 | $1,765 |
| #56 | 1 | 1 | $1,765 |
| #57 | 1 | 1 | $1,765 |
| #58 | 1 | 1 | $1,765 |
| #59 | 1 | 1 | $1,765 |
| #60 | 1 | 1 | $1,765 |
| #61 | 1 | 1 | $1,765 |
| #62 | 1 | 1 | $1,765 |
| #63 | 1 | 1 | $1,765 |
| #64 | 1 | 1 | $1,765 |
| #65 | 1 | 1 | $1,765 |
| #66 | 1 | 1 | $1,765 |
| #67 | 1 | 1 | $1,765 |
| #68 | 1 | 1 | $1,765 |
| #69 | 1 | 1 | $1,765 |
| #70 | 1 | 1 | $1,765 |
| #71 | 1 | 1 | $1,765 |
| #72 | 1 | 1 | $1,765 |
| #73 | 1 | 1 | $1,765 |
| #74 | 1 | 1 | $1,765 |
| #75 | 1 | 1 | $1,765 |
| #76 | 1 | 1 | $1,765 |
| #77 | 1 | 1 | $1,765 |
| #78 | 1 | 1 | $1,765 |
| #79 | 1 | 1 | $1,765 |
| #80 | 1 | 1 | $1,765 |
| #81 | 1 | 1 | $1,765 |
| #82 | 1 | 1 | $1,765 |
| #83 | 1 | 1 | $1,765 |
| #84 | 1 | 1 | $1,765 |
| #85 | 1 | 1 | $1,765 |
| #86 | 1 | 1 | $1,765 |
| #87 | 1 | 1 | $1,765 |
| #88 | 1 | 1 | $1,765 |
| #89 | 1 | 1 | $1,765 |
| #90 | 1 | 1 | $1,765 |
| #91 | 1 | 1 | $1,765 |
| #92 | 1 | 1 | $1,765 |
| #93 | 1 | 1 | $1,765 |
| #94 | 1 | 1 | $1,765 |
| #95 | 1 | 1 | $1,765 |
| #96 | 1 | 1 | $1,765 |
| #97 | 1 | 1 | $1,765 |
| #98 | 1 | 1 | $1,765 |
| #99 | 1 | 1 | $1,765 |
| #100 | 1 | 1 | $1,765 |
| #101 | 1 | 1 | $1,765 |
| #102 | 1 | 1 | $1,765 |
| #103 | 1 | 1 | $1,765 |
| #104 | 1 | 1 | $1,765 |
| #105 | 1 | 1 | $1,765 |
| #106 | 1 | 1 | $1,765 |
| #107 | 1 | 1 | $1,765 |
| #108 | 1 | 1 | $1,765 |
| #109 | 1 | 1 | $1,765 |
| #110 | 1 | 1 | $1,765 |
| #111 | 1 | 1 | $1,765 |
| #112 | 1 | 1 | $1,765 |
| #113 | 1 | 1 | $1,765 |
| #114 | 1 | 1 | $1,765 |
| #115 | 1 | 1 | $1,765 |
| #116 | 1 | 1 | $1,765 |
| #117 | 1 | 1 | $1,765 |
| #118 | 1 | 1 | $1,765 |
| #119 | 1 | 1 | $1,765 |
| #120 | 1 | 1 | $1,765 |
| #121 | 1 | 1 | $1,765 |
| #122 | 1 | 1 | $1,765 |
| #123 | 1 | 1 | $1,765 |
| #124 | 1 | 1 | $1,765 |
| #125 | 1 | 1 | $1,765 |
| #126 | 1 | 1 | $1,765 |
| #127 | 1 | 1 | $1,765 |
| #128 | 1 | 1 | $1,765 |
| #129 | 1 | 1 | $1,765 |
| #130 | 1 | 1 | $1,765 |
| #131 | 1 | 1 | $1,765 |
| #132 | 1 | 1 | $1,765 |
| #133 | 1 | 1 | $1,765 |
| #134 | 1 | 1 | $1,765 |
| #135 | 1 | 1 | $1,765 |
| #136 | 1 | 1 | $1,765 |
| 136× units | 2 | 1 | $310,352 |
| #137 | 2 | 1 | $2,282 |
| #138 | 2 | 1 | $2,282 |
| #139 | 2 | 1 | $2,282 |
| #140 | 2 | 1 | $2,282 |
| #141 | 2 | 1 | $2,282 |
| #142 | 2 | 1 | $2,282 |
| #143 | 2 | 1 | $2,282 |
| #144 | 2 | 1 | $2,282 |
| #145 | 2 | 1 | $2,282 |
| #146 | 2 | 1 | $2,282 |
| #147 | 2 | 1 | $2,282 |
| #148 | 2 | 1 | $2,282 |
| #149 | 2 | 1 | $2,282 |
| #150 | 2 | 1 | $2,282 |
| #151 | 2 | 1 | $2,282 |
| #152 | 2 | 1 | $2,282 |
| #153 | 2 | 1 | $2,282 |
| #154 | 2 | 1 | $2,282 |
| #155 | 2 | 1 | $2,282 |
| #156 | 2 | 1 | $2,282 |
| #157 | 2 | 1 | $2,282 |
| #158 | 2 | 1 | $2,282 |
| #159 | 2 | 1 | $2,282 |
| #160 | 2 | 1 | $2,282 |
| #161 | 2 | 1 | $2,282 |
| #162 | 2 | 1 | $2,282 |
| #163 | 2 | 1 | $2,282 |
| #164 | 2 | 1 | $2,282 |
| #165 | 2 | 1 | $2,282 |
| #166 | 2 | 1 | $2,282 |
| #167 | 2 | 1 | $2,282 |
| #168 | 2 | 1 | $2,282 |
| #169 | 2 | 1 | $2,282 |
| #170 | 2 | 1 | $2,282 |
| #171 | 2 | 1 | $2,282 |
| #172 | 2 | 1 | $2,282 |
| #173 | 2 | 1 | $2,282 |
| #174 | 2 | 1 | $2,282 |
| #175 | 2 | 1 | $2,282 |
| #176 | 2 | 1 | $2,282 |
| #177 | 2 | 1 | $2,282 |
| #178 | 2 | 1 | $2,282 |
| #179 | 2 | 1 | $2,282 |
| #180 | 2 | 1 | $2,282 |
| #181 | 2 | 1 | $2,282 |
| #182 | 2 | 1 | $2,282 |
| #183 | 2 | 1 | $2,282 |
| #184 | 2 | 1 | $2,282 |
| #185 | 2 | 1 | $2,282 |
| #186 | 2 | 1 | $2,282 |
| #187 | 2 | 1 | $2,282 |
| #188 | 2 | 1 | $2,282 |
| #189 | 2 | 1 | $2,282 |
| #190 | 2 | 1 | $2,282 |
| #191 | 2 | 1 | $2,282 |
| #192 | 2 | 1 | $2,282 |
| #193 | 2 | 1 | $2,282 |
| #194 | 2 | 1 | $2,282 |
| #195 | 2 | 1 | $2,282 |
| #196 | 2 | 1 | $2,282 |
| #197 | 2 | 1 | $2,282 |
| #198 | 2 | 1 | $2,282 |
| #199 | 2 | 1 | $2,282 |
| #200 | 2 | 1 | $2,282 |
| #201 | 2 | 1 | $2,282 |
| #202 | 2 | 1 | $2,282 |
| #203 | 2 | 1 | $2,282 |
| #204 | 2 | 1 | $2,282 |
| #205 | 2 | 1 | $2,282 |
| #206 | 2 | 1 | $2,282 |
| #207 | 2 | 1 | $2,282 |
| #208 | 2 | 1 | $2,282 |
| #209 | 2 | 1 | $2,282 |
| #210 | 2 | 1 | $2,282 |
| #211 | 2 | 1 | $2,282 |
| #212 | 2 | 1 | $2,282 |
| #213 | 2 | 1 | $2,282 |
| #214 | 2 | 1 | $2,282 |
| #215 | 2 | 1 | $2,282 |
| #216 | 2 | 1 | $2,282 |
| #217 | 2 | 1 | $2,282 |
| #218 | 2 | 1 | $2,282 |
| #219 | 2 | 1 | $2,282 |
| #220 | 2 | 1 | $2,282 |
| #221 | 2 | 1 | $2,282 |
| #222 | 2 | 1 | $2,282 |
| #223 | 2 | 1 | $2,282 |
| #224 | 2 | 1 | $2,282 |
| #225 | 2 | 1 | $2,282 |
| #226 | 2 | 1 | $2,282 |
| #227 | 2 | 1 | $2,282 |
| #228 | 2 | 1 | $2,282 |
| #229 | 2 | 1 | $2,282 |
| #230 | 2 | 1 | $2,282 |
| #231 | 2 | 1 | $2,282 |
| #232 | 2 | 1 | $2,282 |
| #233 | 2 | 1 | $2,282 |
| #234 | 2 | 1 | $2,282 |
| #235 | 2 | 1 | $2,282 |
| #236 | 2 | 1 | $2,282 |
| #237 | 2 | 1 | $2,282 |
| #238 | 2 | 1 | $2,282 |
| #239 | 2 | 1 | $2,282 |
| #240 | 2 | 1 | $2,282 |
| #241 | 2 | 1 | $2,282 |
| #242 | 2 | 1 | $2,282 |
| #243 | 2 | 1 | $2,282 |
| #244 | 2 | 1 | $2,282 |
| #245 | 2 | 1 | $2,282 |
| #246 | 2 | 1 | $2,282 |
| #247 | 2 | 1 | $2,282 |
| #248 | 2 | 1 | $2,282 |
| #249 | 2 | 1 | $2,282 |
| #250 | 2 | 1 | $2,282 |
| #251 | 2 | 1 | $2,282 |
| #252 | 2 | 1 | $2,282 |
| #253 | 2 | 1 | $2,282 |
| #254 | 2 | 1 | $2,282 |
| #255 | 2 | 1 | $2,282 |
| #256 | 2 | 1 | $2,282 |
| #257 | 2 | 1 | $2,282 |
| #258 | 2 | 1 | $2,282 |
| #259 | 2 | 1 | $2,282 |
| #260 | 2 | 1 | $2,282 |
| #261 | 2 | 1 | $2,282 |
| #262 | 2 | 1 | $2,282 |
| #263 | 2 | 1 | $2,282 |
| #264 | 2 | 1 | $2,282 |
| #265 | 2 | 1 | $2,282 |
| #266 | 2 | 1 | $2,282 |
| #267 | 2 | 1 | $2,282 |
| #268 | 2 | 1 | $2,282 |
| #269 | 2 | 1 | $2,282 |
| #270 | 2 | 1 | $2,282 |
| #271 | 2 | 1 | $2,282 |
| #272 | 2 | 1 | $2,282 |
| 136× units | 3 | 1 | $351,696 |
| #273 | 3 | 1 | $2,586 |
| #274 | 3 | 1 | $2,586 |
| #275 | 3 | 1 | $2,586 |
| #276 | 3 | 1 | $2,586 |
| #277 | 3 | 1 | $2,586 |
| #278 | 3 | 1 | $2,586 |
| #279 | 3 | 1 | $2,586 |
| #280 | 3 | 1 | $2,586 |
| #281 | 3 | 1 | $2,586 |
| #282 | 3 | 1 | $2,586 |
| #283 | 3 | 1 | $2,586 |
| #284 | 3 | 1 | $2,586 |
| #285 | 3 | 1 | $2,586 |
| #286 | 3 | 1 | $2,586 |
| #287 | 3 | 1 | $2,586 |
| #288 | 3 | 1 | $2,586 |
| #289 | 3 | 1 | $2,586 |
| #290 | 3 | 1 | $2,586 |
| #291 | 3 | 1 | $2,586 |
| #292 | 3 | 1 | $2,586 |
| #293 | 3 | 1 | $2,586 |
| #294 | 3 | 1 | $2,586 |
| #295 | 3 | 1 | $2,586 |
| #296 | 3 | 1 | $2,586 |
| #297 | 3 | 1 | $2,586 |
| #298 | 3 | 1 | $2,586 |
| #299 | 3 | 1 | $2,586 |
| #300 | 3 | 1 | $2,586 |
| #301 | 3 | 1 | $2,586 |
| #302 | 3 | 1 | $2,586 |
| #303 | 3 | 1 | $2,586 |
| #304 | 3 | 1 | $2,586 |
| #305 | 3 | 1 | $2,586 |
| #306 | 3 | 1 | $2,586 |
| #307 | 3 | 1 | $2,586 |
| #308 | 3 | 1 | $2,586 |
| #309 | 3 | 1 | $2,586 |
| #310 | 3 | 1 | $2,586 |
| #311 | 3 | 1 | $2,586 |
| #312 | 3 | 1 | $2,586 |
| #313 | 3 | 1 | $2,586 |
| #314 | 3 | 1 | $2,586 |
| #315 | 3 | 1 | $2,586 |
| #316 | 3 | 1 | $2,586 |
| #317 | 3 | 1 | $2,586 |
| #318 | 3 | 1 | $2,586 |
| #319 | 3 | 1 | $2,586 |
| #320 | 3 | 1 | $2,586 |
| #321 | 3 | 1 | $2,586 |
| #322 | 3 | 1 | $2,586 |
| #323 | 3 | 1 | $2,586 |
| #324 | 3 | 1 | $2,586 |
| #325 | 3 | 1 | $2,586 |
| #326 | 3 | 1 | $2,586 |
| #327 | 3 | 1 | $2,586 |
| #328 | 3 | 1 | $2,586 |
| #329 | 3 | 1 | $2,586 |
| #330 | 3 | 1 | $2,586 |
| #331 | 3 | 1 | $2,586 |
| #332 | 3 | 1 | $2,586 |
| #333 | 3 | 1 | $2,586 |
| #334 | 3 | 1 | $2,586 |
| #335 | 3 | 1 | $2,586 |
| #336 | 3 | 1 | $2,586 |
| #337 | 3 | 1 | $2,586 |
| #338 | 3 | 1 | $2,586 |
| #339 | 3 | 1 | $2,586 |
| #340 | 3 | 1 | $2,586 |
| #341 | 3 | 1 | $2,586 |
| #342 | 3 | 1 | $2,586 |
| #343 | 3 | 1 | $2,586 |
| #344 | 3 | 1 | $2,586 |
| #345 | 3 | 1 | $2,586 |
| #346 | 3 | 1 | $2,586 |
| #347 | 3 | 1 | $2,586 |
| #348 | 3 | 1 | $2,586 |
| #349 | 3 | 1 | $2,586 |
| #350 | 3 | 1 | $2,586 |
| #351 | 3 | 1 | $2,586 |
| #352 | 3 | 1 | $2,586 |
| #353 | 3 | 1 | $2,586 |
| #354 | 3 | 1 | $2,586 |
| #355 | 3 | 1 | $2,586 |
| #356 | 3 | 1 | $2,586 |
| #357 | 3 | 1 | $2,586 |
| #358 | 3 | 1 | $2,586 |
| #359 | 3 | 1 | $2,586 |
| #360 | 3 | 1 | $2,586 |
| #361 | 3 | 1 | $2,586 |
| #362 | 3 | 1 | $2,586 |
| #363 | 3 | 1 | $2,586 |
| #364 | 3 | 1 | $2,586 |
| #365 | 3 | 1 | $2,586 |
| #366 | 3 | 1 | $2,586 |
| #367 | 3 | 1 | $2,586 |
| #368 | 3 | 1 | $2,586 |
| #369 | 3 | 1 | $2,586 |
| #370 | 3 | 1 | $2,586 |
| #371 | 3 | 1 | $2,586 |
| #372 | 3 | 1 | $2,586 |
| #373 | 3 | 1 | $2,586 |
| #374 | 3 | 1 | $2,586 |
| #375 | 3 | 1 | $2,586 |
| #376 | 3 | 1 | $2,586 |
| #377 | 3 | 1 | $2,586 |
| #378 | 3 | 1 | $2,586 |
| #379 | 3 | 1 | $2,586 |
| #380 | 3 | 1 | $2,586 |
| #381 | 3 | 1 | $2,586 |
| #382 | 3 | 1 | $2,586 |
| #383 | 3 | 1 | $2,586 |
| #384 | 3 | 1 | $2,586 |
| #385 | 3 | 1 | $2,586 |
| #386 | 3 | 1 | $2,586 |
| #387 | 3 | 1 | $2,586 |
| #388 | 3 | 1 | $2,586 |
| #389 | 3 | 1 | $2,586 |
| #390 | 3 | 1 | $2,586 |
| #391 | 3 | 1 | $2,586 |
| #392 | 3 | 1 | $2,586 |
| #393 | 3 | 1 | $2,586 |
| #394 | 3 | 1 | $2,586 |
| #395 | 3 | 1 | $2,586 |
| #396 | 3 | 1 | $2,586 |
| #397 | 3 | 1 | $2,586 |
| #398 | 3 | 1 | $2,586 |
| #399 | 3 | 1 | $2,586 |
| #400 | 3 | 1 | $2,586 |
| #401 | 3 | 1 | $2,586 |
| #402 | 3 | 1 | $2,586 |
| #403 | 3 | 1 | $2,586 |
| #404 | 3 | 1 | $2,586 |
| #405 | 3 | 1 | $2,586 |
| #406 | 3 | 1 | $2,586 |
| #407 | 3 | 1 | $2,586 |
| #408 | 3 | 1 | $2,586 |
| Total (408 units) | $902,200 | ||
UW: 25.0% down · 7.5% · 30yr · 1.5% tax · 5.0% vac · 8.0% maint · 8.0% mgmt
Financing live
Cash to close
- Down payment
- $12,533,935
- Closing costs
- $1,504,072
- Reserves months
- —
- Total cash needed
- —
Loan-product check · same deal, 3 products live
Conventional
25% down · 7.5% · 30yr
- Down + closing
- —
- Monthly P&I
- —
- Monthly cashflow
- —
- DSCR
- —
- Eligible?
- —
Personal DTI + credit; lowest rate.
DSCR
20% down · 8.5% · 30yr
- Down + closing
- —
- Monthly P&I
- —
- Monthly cashflow
- —
- DSCR
- —
- Eligible?
- —
No personal income docs; deal must DSCR.
Hard money
10% down · 12.0% · 12mo
- Down + closing
- —
- Monthly P&I
- —
- Monthly cashflow
- —
- DSCR
- —
- Eligible?
- —
Short-term bridge; refi at stabilization.
Rent comps 14 comps
| Address | Beds | Baths | Sqft | Rent | $/sqft | DOM | Units | Dist |
|---|---|---|---|---|---|---|---|---|
| 6901 NE 131st Way Vancouver, WA | 2.0–3.0 | 2.0 | 1155 | $1,749 | $1.51 | 0d | 5 | 0.34mi |
| 6958 NE 131st Way Vancouver, WA | 3.0 | 2.5 | 1917 | $2,995 | $1.56 | 4d | 1 | 0.36mi |
| 6816 NE 131st Way Unit 1546002P Vancouver, WA | 2.0 | 2.0 | 1915 | $3,226 | $1.68 | 16d | 1 | 0.37mi |
| 6812 NE 131st Way Vancouver, WA | 3.0 | 2.5 | 1917 | $2,895 | $1.51 | 25d | 1 | 0.37mi |
| 13121 NE 71st Pl Vancouver, WA | 3.0 | 2.5 | 1624 | $2,595 | $1.60 | 18d | 1 | 0.38mi |
| 7009 NE 132nd Way Vancouver, WA | 3.0 | 2.5 | 1917 | $2,825 | $1.47 | 45d | 1 | 0.39mi |
| 6931 NE 132nd Way Vancouver, WA | 3.0 | 2.5 | 1917 | $2,995 | $1.56 | 45d | 1 | 0.39mi |
| 6919 NE 132nd Way Vancouver, WA | 3.0 | 2.5 | 1917 | $2,895 | $1.51 | 45d | 1 | 0.39mi |
| 6907 NE 132nd Way Vancouver, WA | 3.0 | 2.5 | 1917 | $2,825 | $1.47 | 45d | 1 | 0.39mi |
| 10617 NE 60th Ct Vancouver, WA | 3.0 | 2.5 | 1770 | $2,595 | $1.47 | 45d | 1 | 0.98mi |
| 10406 NE 69th Ave Vancouver, WA | 3.0 | 2.0 | 2041 | $2,915 | $1.43 | 0d | 1 | 1.02mi |
| 10406 NE 69th Ave Vancouver, WA | 3.0 | 2.0 | 2041 | $2,915 | $1.43 | 25d | 1 | 1.02mi |
| 9716 NE 61st Ct Vancouver, WA | 3.0 | 2.0 | 1514 | $2,495 | $1.65 | 25d | 1 | 1.41mi |
| 10601 NE 45th Ave Vancouver, WA | 3.0 | 2.0 | 1409 | $2,750 | $1.95 | 45d | 1 | 1.50mi |
Listing history 14 events
-
2026-06-21days on market $50,135,740 Active 24 DOM
-
2026-06-18days on market $50,135,740 Active 21 DOM
-
2026-06-17days on market $50,135,740 Active 20 DOM
-
2026-06-16days on market $50,135,740 Active 19 DOM
-
2026-06-15days on market $50,135,740 Active 18 DOM
-
2026-06-13days on market $50,135,740 Active 16 DOM
-
2026-06-09days on market $50,135,740 Active 12 DOM
-
2026-06-08days on market $50,135,740 Active 11 DOM
-
2026-06-07days on market $50,135,740 Active 10 DOM
-
2026-06-03days on market $50,135,740 Active 6 DOM
-
2026-06-02days on market $50,135,740 Active 5 DOM
-
2026-06-01days on market $50,135,740 Active 4 DOM
-
2026-05-31days on market $50,135,740 Active 3 DOM
-
2026-05-28$50,135,740 Active
ⓘ Source: listings_history table (triggers on properties + properties_extension) + one-shot
backfill from property_details.listing_events for pre-trigger history.
Climate risk First Street
- Flood 1/10 Low FEMA zone X (unshaded) · 0% chance over 30 yrs
- Wildfire 4/10 Moderate
- Heat 3/10 Moderate 7 d/yr ≥91°F today · 15 d/yr by 30 yrs out
- Wind 1/10 Low
- Air quality 9/10 Extreme 15 unhealthy d/yr today · 15 by 30 yrs out
Nearby sold comps map
Loading sold comps map…
Walkable amenities ~0.75 mi
Loading nearby amenities…
Taxation est. · year 1
- Rental income
- $10,826,400
- − Mortgage interest
- −$2,808,381
- − Property taxes
- −$752,036
- − Insurance
- −$250,679
- − Repairs & maintenance
- −$866,112
- − Management
- −$866,112
- − Depreciation
- −$1,458,494
- Taxable income
- $3,824,586
- Est. tax owed @ 24.0%
- −$917,901
- After-tax cash flow
- $3,477,233/yr
For passive investors: Depreciation is non-cash, so a rental often shows a tax loss while cash-flowing — sheltering income. Rental losses are passive: they offset passive income freely, and up to $25,000/yr can offset ordinary (W-2) income if you actively participate and your MAGI is under $100k (phasing out to $0 by $150k); unused losses carry forward. On sale, claimed depreciation is recaptured at up to 25%, and gains may owe capital-gains tax (a 1031 exchange can defer both). Figures are a year-1 estimate at your 24.0% rate — not tax advice; consult a CPA.
Schools (NCES district)
- District
- Battle Ground School District
- NCES district ID
- 5300380
- Math proficiency
- 48% ▼ -1.00%
- Reading proficiency
- 60% ▼ -1.00%
- Median HH income
- $69,646
- Composite
- 49.81/100
- National rank
- #4201
- State rank
- #92 of 291 in WA
Livability — Barberton
- Score
- 72/100
- State rank
- #223
- US rank
- #6415
Category grades
Schools grade is shown separately in the Schools card above.
Census & demographics
- Census place
- Barberton, WA
- County
- Clark County · 513,189 people
- City population
- 20,553
- Metro
- Portland-Vancouver-Hillsboro, OR-WA
- Population (ZIP)
- 21,243
- Household income
- $107,801
- Rent vs Own
- Severe rent burden
- 364.0
Population outlook (Clark County) Hauer SSP2
- Today (2025)
- 529,610 people
- By 2030
- 563,242 · +6.4%
- By 2040
- 625,905 · +18.2%
- By 2050
- 681,558 · +28.7%
- By 2075
- 805,967 · +52.2%
- By 2100
- 877,450 · +65.7%
Race, ethnicity, and origin ACS 2023
- Neighborhood character
- Predominantly White (74%)
- Race & ethnicity
- White 74% Two or more races 10% Hispanic / Latino 9% Asian 6% Black 2%
- Hispanic origin (detail)
- Mexican 6%
- Common ancestry
- Portuguese 6% Slovak 4% Lithuanian 4%
- Foreign-born
- 10% · Canada, Vietnam, South Korea
- Languages at home
- 87% English-only · Spanish 4% Russian/Polish/Slavic 2% Other Indo-European 1%
Political lean MEDSL · Clark
- 2024 margin
- Lean D (+7.0) · D 52.1% · R 45.1% · Other 2.8%
- 2008→2024 swing
- +0.9pp no change · 2008: 6.1pp · 2024: 7.0pp
- All cycles
- 2024: D+7.0 2020: D+5.1 2016: D+0.1 2012: D+0.1 2008: D+6.1
Not yet ingested
- Civics
- —
Market trends
- HPI YoY
- ▼ -274.58%
- Current HPI
- 286.8751
- Rent YoY
- ▲ 0.78%
- Metro
- Portland-Vancouver-Hillsboro, OR-WA
- State GDP YoY
- ▲ 4.65%
- F500 in state
- 22
Industry mix (Fortune 500 HQ in WA)
| Industry | F500 HQs | Revenue |
|---|---|---|
| Retail | 2 | $269B |
|
||
| Technology / Retail | 1 | $638B |
|
||
| Technology | 1 | $245B |
|
||
| Telecommunications | 1 | $38B |
|
||
| Food / Beverage | 1 | $36B |
|
||
| Automotive / Trucks | 1 | $34B |
|
||
Price history
1 event — show timeline
- 2026-05-28 Listed $50,135,740 RMLS
Property tax history
+9.9%/yrLatest (2026): $15,232 · +1.7% YoY. Source: county tax records.
Cash-flow waterfall
monthlySold comps — $/sqft
last 12 mo · ≤1 miLoading sold comps…