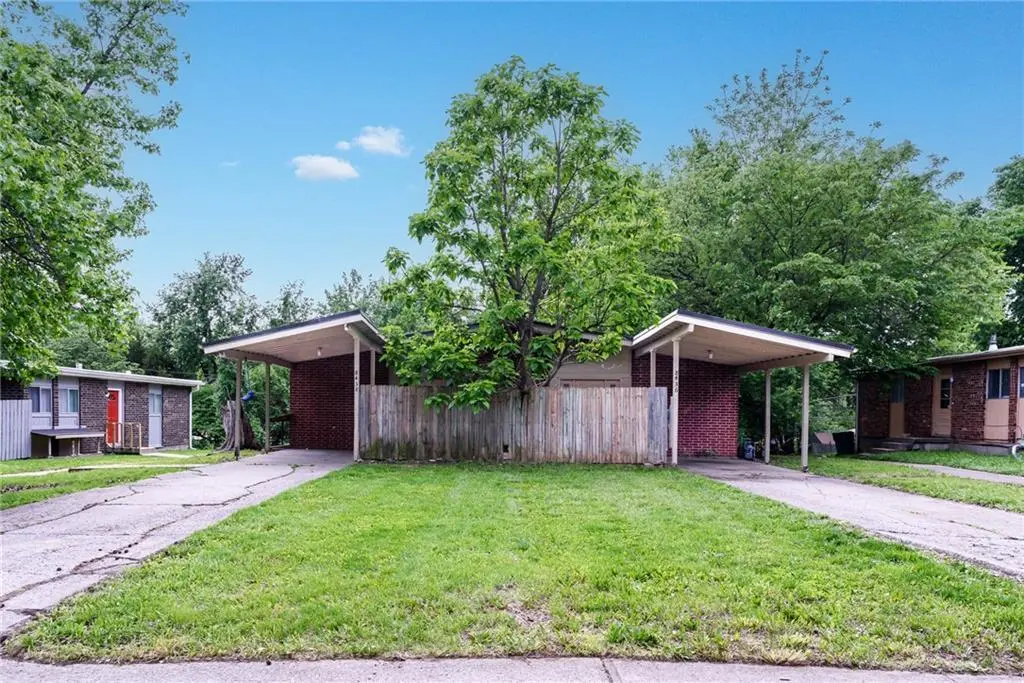
8436 Kessler St
Overland Park, KS 66212
$325,000C-
4 bd · 2.0 ba ·
2,090 sqft ·
Built 1965
· MultiFamily
· Pending
· 17 DOM
Cashflow @ list (25.0% down · 7.5%)
Estimated rent
$3,135/mo
Mortgage (P&I)
−$1,704
Tax + insurance
−$375
HOA
−$0
Vac / Maint / Mgmt
−$658
Net cashflow
$397/mo
Annual
$4,770/yr
Cap rate
7.76%
Cash-on-cash
5.24%
DSCR
1.23
1% rule
0.96%
Cash to close
$91,000
Investor read
- This is a 2 × 2-bed/1.0-bath units multifamily listed at $325k.
- At list price, monthly cash flow is $397 ($5k/yr) — positive. Per door: $199/mo.
- The deal already cash-flows at list — no discount required.
- To meet the 1% rule (rent ≥ 1% of price), the offer needs to be $314k (3.5% below list).
- It's been on market 17 days — a 2% lower offer ($320k) is reasonable based on typical stale-listing flexibility.
- Recommended offer: $314k (3.5% below list) — sets the bar for 1% rule.
- Local home prices are declining (-3.0%/yr); year-one equity from $2k of loan paydown is wiped out by about $10k of value loss. Plan a longer hold.
- Location reads 80/100 on livability (#16 in KS, #1,851 nationally) — a professional / high-income tenant draw. Strengths: employment A+, housing A+, crime B; Watch: health & safety C-, commute D+.
- Shawnee Mission Pub Schools (suburban): math 38% / reading 46% proficiency, ranked #22 of 169 in KS (top 13%) — families likely to look elsewhere, expect single-tenant / working-renter base with shorter leases.
- Zoned schools: Comanche Elem (math 22% / reading 37%, grade F, #463 of 684 statewide, top 73%, 381 students, 79% FRL); Westridge Middle (math 15% / reading 23%, grade F, #159 of 219 statewide, top 73%, 811 students, 58% FRL) — zoned schools average 69% FRL vs 29% district-wide (40 pts higher); higher-poverty schools than district average — tighter screening recommended.
- Zoned-school proficiency averages 24% at this address vs 42% district-wide (-18 pts) — the specific schools serving this property underperform the Shawnee Mission Pub Schools average; the district grade overstates school quality for this exact location.
- Market conditions: Rents rising fast (+5.9%/yr); 142 active listings in the ZIP; 11 comparable units currently listed for rent nearby; rentals at typical pace (median 19d on market — plan ~3-4 weeks tenant-placement turnaround); solid renter incomes; 2,969 units permitted in Johnson County in 2024 (1,066 in 5+ unit buildings).
- Johnson County population projected at +27% by 2050 — long-run rental-demand tailwind backs the buy-and-hold thesis.
- Cap rate 7.8% vs local median 3.9% in Overland Park — top-decile yield for the area; either an underpriced asset or a hidden risk that comps aren't pricing in. Stress-test before assuming the spread holds.
- At $3,135/mo this rent would consume 46% of the median local household income ($81k/yr) (locally 1224% of renters already pay >50% of income on rent) — very limited rent-growth headroom before tenants either downsize or default.
Questions for listing agent
- Can we see the unit-by-unit rent roll, current vacancy, and any below-market leases? What's the average tenancy length?
- What capital expenditures (roof, boiler, parking lot, exteriors) have been made in the last 5 years, and what's planned in the next 2?
- Built in 1965 — when were the roof, HVAC, electrical panel, plumbing, and water heater last replaced?
- Is there a deadline driving the sale (1031 exchange, divorce, estate, relocation)? That informs how much negotiation room exists.
- Schools are B-rated — typically a magnet for longer-tenancy family renters. What's the average tenant stay here, and is there a school-zone premium baked into asking?
- What's the average days-on-market for RENTAL listings here right now (not sales)? A rising rental-DOM trend means longer vacancies and softer asking-rent achievability than the comps imply.
- What's the recent tenant-quality profile in this submarket — average credit score on applications, eviction rate, late-payment / NSF rate, and stable-employment percentage? A property-management company in the area should have these aggregated.
- How much new apartment / multifamily construction is in the pipeline within 1–3 miles? Heavy new supply (>2% of stock underway) typically softens rents 12–24 months out; light construction supports rent growth.
CashFlowRE · CFR-6G8ZGT3K8Y0SQA
· Data 4 weeks ago
cashflowre.app · 2026-05-29