 Duplex
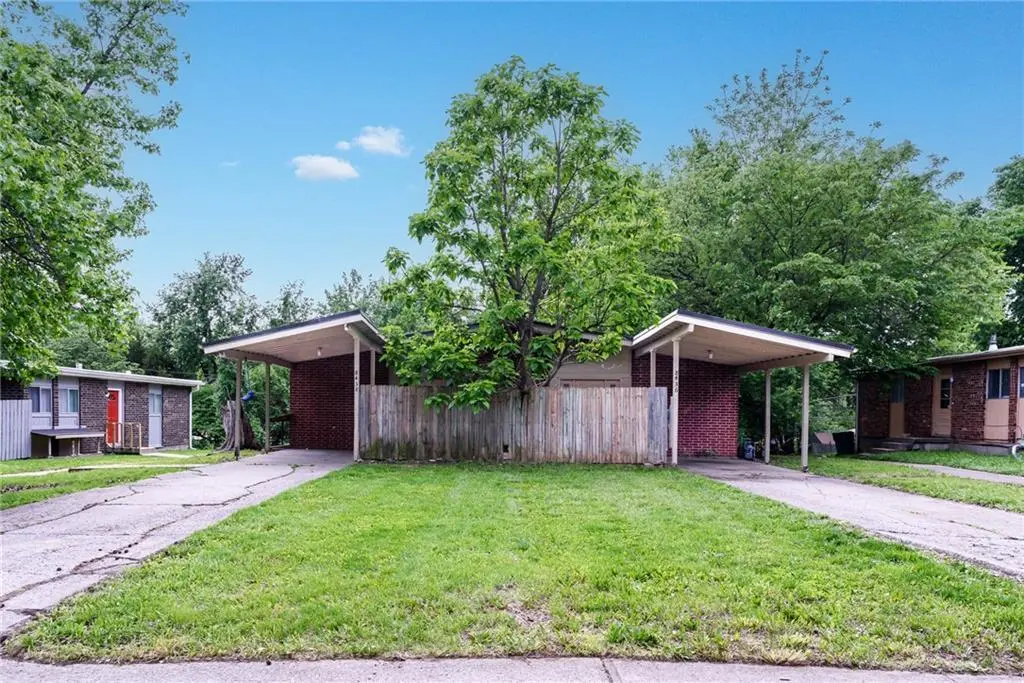
8436 Kessler St · Overland Park, KS
Flood risk 1/10 · Minimal
- FEMA flood zone
- X (unshaded)
- Chance of flooding over 30 yrs
- 0.0%
- Est. flood insurance / yr
- $473 – $860
Fire risk 1/10 · Minimal
- Est. fire insurance / yr
- $1,154 – $2,142
Heat risk 4/10 · Minor
- Hot days now (above 107°F)
- 7 days/yr
- Hot days in 30 yrs
- 17 days/yr
Wind risk 2/10 · Minimal
- Chance of severe wind over 30 yrs
- —
Air-quality risk 2/10 · Minimal
- Unhealthy air days now
- 2 days/yr
- Unhealthy air days in 30 yrs
- 2 days/yr
Risk factors via First Street. Map © Google.
Why this score? — see what drove the C- grade
The composite is a weighted blend of 9 inputs, each scored 0–100. Each bar is that input's sub-score; the figure is the points it added to the 100-point composite (weight × sub-score).
- Cash flow +20.0/30.0
- ARV discount +7.5/15.0
- DSCR +6.3/10.0
- 1% rule +4.6/10.0
- Rent growth +4.0/5.0
- Livability +4.0/5.0
- Schools +3.8/10.0
- Condition / age +2.5/5.0
- Appreciation +0.0/10.0
$325,000
🖨 Deal sheet (PDF) 📄 Offer letter ✓ Due diligence
Multi-family units
County records classify this as Multi-Family (2-4 Unit). Listing-text estimate: 2 units. confirmed
Listing remarks
INVESTMENT OPPORTUNITY IN A GREAT LOCATION! This full duplex offers 2 bedrooms and 1 full bath on each side. Basement has family room, laundry area and tons of storage. Plus 1 carport for each unit, making it a smart choice for both homeowners and investors. Live in one side and rent the other, or rent both for strong income potential. With its practical layout and desirable location, this property gives you flexibility and room to grow.
Key facts
- 0.25 acre lot
- 2 parking spots
- Built 1965
Property features AI
Finance
- Financial info: Tax annual amount provided (see listing for details)
Exterior
- Parking: Carport (total parking for 2)
- Utilities: Public water; Public sewer; Separate meters
- Home design: Duplex (residential income property); Single-story
- Construction: Frame construction; Composition roof
- Exterior features: Property located inside city limits; Not in a flood plain; Lot approximately 10,707 square feet (public records)
Interior
- Bedrooms: Two-bedroom units (unit count: 2)
- Bathrooms: Each unit has 1 bathroom
- Heating & cooling: Forced air heating; Electric cooling
- Interior features: Basement present
Neighborhood map
What this means for you Summary
Snapshot
- This is a 2 × 2-bed/1.0-bath units multifamily listed at $325k.
Deal economics
- At list price, monthly cash flow is $397 ($5k/yr) — positive. Per door: $199/mo.
- The deal already cash-flows at list — no discount required.
- To meet the 1% rule (rent ≥ 1% of price), the offer needs to be $314k (3.5% below list).
- Recommended offer: $314k (3.5% below list) — sets the bar for 1% rule.
- Cap rate 7.8% vs local median 3.9% in Overland Park — top-decile yield for the area; either an underpriced asset or a hidden risk that comps aren't pricing in. Stress-test before assuming the spread holds.
Location & tenants
- Location reads 80/100 on livability (#16 in KS, #1,851 nationally) — a professional / high-income tenant draw. Strengths: employment A+, housing A+, crime B; Watch: health & safety C-, commute D+.
- Shawnee Mission Pub Schools (suburban): math 38% / reading 46% proficiency, ranked #22 of 169 in KS (top 13%) — families likely to look elsewhere, expect single-tenant / working-renter base with shorter leases.
- Zoned schools: Comanche Elem (math 22% / reading 37%, grade F, #463 of 684 statewide, top 73%, 381 students, 79% FRL); Westridge Middle (math 15% / reading 23%, grade F, #159 of 219 statewide, top 73%, 811 students, 58% FRL) — zoned schools average 69% FRL vs 29% district-wide (40 pts higher); higher-poverty schools than district average — tighter screening recommended.
- Zoned-school proficiency averages 24% at this address vs 42% district-wide (-18 pts) — the specific schools serving this property underperform the Shawnee Mission Pub Schools average; the district grade overstates school quality for this exact location.
- Market conditions: Rents rising fast (+5.9%/yr); 142 active listings in the ZIP; 11 comparable units currently listed for rent nearby; rentals at typical pace (median 19d on market — plan ~3-4 weeks tenant-placement turnaround); solid renter incomes; 2,969 units permitted in Johnson County in 2024 (1,066 in 5+ unit buildings).
- At $3,135/mo this rent would consume 46% of the median local household income ($81k/yr) (locally 1224% of renters already pay >50% of income on rent) — very limited rent-growth headroom before tenants either downsize or default.
Forward outlook
- Local home prices are declining (-3.0%/yr); year-one equity from $2k of loan paydown is wiped out by about $10k of value loss. Plan a longer hold.
- Johnson County population projected at +27% by 2050 — long-run rental-demand tailwind backs the buy-and-hold thesis.
Negotiation context
- It's been on market 17 days — a 2% lower offer ($320k) is reasonable based on typical stale-listing flexibility.
Questions for the listing agent
- Can we see the unit-by-unit rent roll, current vacancy, and any below-market leases? What's the average tenancy length?
- What capital expenditures (roof, boiler, parking lot, exteriors) have been made in the last 5 years, and what's planned in the next 2?
- Built in 1965 — when were the roof, HVAC, electrical panel, plumbing, and water heater last replaced?
- Is there a deadline driving the sale (1031 exchange, divorce, estate, relocation)? That informs how much negotiation room exists.
- Schools are B-rated — typically a magnet for longer-tenancy family renters. What's the average tenant stay here, and is there a school-zone premium baked into asking?
- What's the average days-on-market for RENTAL listings here right now (not sales)? A rising rental-DOM trend means longer vacancies and softer asking-rent achievability than the comps imply.
- What's the recent tenant-quality profile in this submarket — average credit score on applications, eviction rate, late-payment / NSF rate, and stable-employment percentage? A property-management company in the area should have these aggregated.
- How much new apartment / multifamily construction is in the pipeline within 1–3 miles? Heavy new supply (>2% of stock underway) typically softens rents 12–24 months out; light construction supports rent growth.
Investment metrics
- 1% rule
- 0.96% ✗
- Cap rate
- 7.76%
- Cash-on-cash
- 5.24%
- DSCR
- 1.23
- GRM
- 8.6
CMA / ARV
No comps found within radius.
Projected returns pro-forma
-3.0% appreciation · 5.91% rent growth · sell at horizon
- IRR
- -5.2%
- Equity multiple
- 0.80×
- Total profit
- $-17,958
- Equity at exit
- $48,459
- IRR
- 7.5%
- Equity multiple
- 1.64×
- Total profit
- $57,884
- Equity at exit
- $28,100
Cash invested: $91,000 (down + closing). Projections, not guarantees.
Landlord ↔ Tenant lean methodology
- Overall (STATE)
- 83 Strongly Landlord-Friendly
- State Kansas
- 83 Strongly Landlord-Friendly · R+10
- County
- — inherits STATE
- City
- — inherits STATE
ZIP-level market 66212
- Rents YoY
- 5.9%
- Active inventory
- 142
- Price-to-rent
- 17.3×
Monthly cashflow live
- Estimated rent
- $3,135 high interval (Pro) →
- Mortgage (P&I)
- −$1,704
- Tax from tax record
- −$239 /mo · $2,873/yr
- Insurance
- −$135
- HOA
- −$0
- Vacancy / Maint / Mgmt
- −$658
- Net cashflow
- $397
Break-even live
Sensitivity live
| Price | -10% $581 | -5% $489 | +0% $397 | +5% $305 | +10% $213 |
|---|---|---|---|---|---|
| Rent | -10% $150 | -5% $274 | +0% $397 | +5% $521 | +10% $645 |
| Rate | -1.0pp $561 | -0.5pp $480 | base $397 | +0.5pp $313 | +1.0pp $228 |
2-unit breakdown (identical units grouped — click to expand)
| Units | Beds | Baths | Est. rent |
|---|---|---|---|
| 2× units | 2 | 1 | $3,136 |
| #1 | 2 | 1 | $1,568 |
| #2 | 2 | 1 | $1,568 |
| Total (2 units) | $3,135 | ||
UW: 25.0% down · 7.5% · 30yr · 1.5% tax · 5.0% vac · 8.0% maint · 8.0% mgmt
Financing live
Cash to close
- Down payment
- $81,250
- Closing costs
- $9,750
- Reserves months
- —
- Total cash needed
- —
Loan-product check · same deal, 3 products live
Conventional
25% down · 7.5% · 30yr
- Down + closing
- —
- Monthly P&I
- —
- Monthly cashflow
- —
- DSCR
- —
- Eligible?
- —
Personal DTI + credit; lowest rate.
DSCR
20% down · 8.5% · 30yr
- Down + closing
- —
- Monthly P&I
- —
- Monthly cashflow
- —
- DSCR
- —
- Eligible?
- —
No personal income docs; deal must DSCR.
Hard money
10% down · 12.0% · 12mo
- Down + closing
- —
- Monthly P&I
- —
- Monthly cashflow
- —
- DSCR
- —
- Eligible?
- —
Short-term bridge; refi at stabilization.
Rent comps 11 comps
| Address | Beds | Baths | Sqft | Rent | $/sqft | DOM | Units | Dist |
|---|---|---|---|---|---|---|---|---|
| 8403 Carter St Overland Park, KS | 2.0–3.0 | 1.0–2.0 | 1732 | $4,750 | $2.74 | 12d | 1 | 0.23mi |
| 8342 Wedd St Overland Park, KS | 1.0–3.0 | 1.0–2.0 | 1223 | $1,455 | $1.19 | 25d | 1 | 0.49mi |
| 7985 Antioch Rd Overland Park, KS | 5.0 | 3.0 | 2196 | $3,000 | $1.37 | 9d | 1 | 0.76mi |
| 9130 W 78th St Overland Park, KS | 3.0 | 2.0 | 1527 | $1,745 | $1.14 | 19d | 1 | 0.95mi |
| 9128 W 78th St Overland Park, KS | 3.0 | 2.0 | 1527 | $1,745 | $1.14 | 14d | 1 | 0.96mi |
| 9109 Goddard St Overland Park, KS | 5.0 | 3.0 | 2710 | $3,195 | $1.18 | 5d | 1 | 1.19mi |
| 9236 Switzer St Overland Park, KS | 4.0 | 2.0 | 1968 | $2,613 | $1.33 | 23d | 1 | 1.20mi |
| 8712 Marty Ln Overland Park, KS | 5.0 | 2.0 | 2031 | $2,521 | $1.24 | 25d | 1 | 1.22mi |
| 9108 W 95th St Overland Park, KS | 3.0 | 2.5 | 1632 | $2,200 | $1.35 | 12d | 1 | 1.25mi |
| 9152 Foster St Overland Park, KS | 1.0–3.0 | 1.0–2.5 | 1123 | $1,887 | $1.68 | 25d | 1 | 1.38mi |
| 9436 Craig Dr Overland Park, KS | 3.0 | 2.5 | 1848 | $2,326 | $1.26 | 25d | 1 | 1.45mi |
Listing history 3 events
-
2026-05-21status Pending
-
2026-05-05$325,000 Active
-
2026-04-20historical $325,000
ⓘ Source: listings_history table (triggers on properties + properties_extension) + one-shot
backfill from property_details.listing_events for pre-trigger history.
Tax reassessment forecast KS · Resets to sale price
- Current annual tax
- $2,873 · $239/mo
- Projected year-2 tax
- $4,582 · $382/mo
- Expected delta
- +$1,709/yr (+$142/mo · 59.5%)
ⓘ Screening estimate from a state-policy table — verify with the county assessor before closing.
Climate risk First Street
- Flood 1/10 Low FEMA zone X (unshaded) · 0% chance over 30 yrs
- Wildfire 1/10 Low
- Heat 4/10 Moderate 7 d/yr ≥107°F today · 17 d/yr by 30 yrs out
- Wind 2/10 Low
- Air quality 2/10 Low 2 unhealthy d/yr today · 2 by 30 yrs out
Nearby sold comps map
Loading sold comps map…
Walkable amenities ~0.75 mi
Loading nearby amenities…
Taxation est. · year 1
- Rental income
- $37,620
- − Mortgage interest
- −$18,205
- − Property taxes
- −$2,873
- − Insurance
- −$1,625
- − Repairs & maintenance
- −$3,010
- − Management
- −$3,010
- − Depreciation
- −$9,455
- Taxable loss
- −$557
- Est. tax savings @ 24.0%
- +$134
- After-tax cash flow
- $4,903/yr
For passive investors: Depreciation is non-cash, so a rental often shows a tax loss while cash-flowing — sheltering income. Rental losses are passive: they offset passive income freely, and up to $25,000/yr can offset ordinary (W-2) income if you actively participate and your MAGI is under $100k (phasing out to $0 by $150k); unused losses carry forward. On sale, claimed depreciation is recaptured at up to 25%, and gains may owe capital-gains tax (a 1031 exchange can defer both). Figures are a year-1 estimate at your 24.0% rate — not tax advice; consult a CPA.
Schools (NCES district)
- District
- Shawnee Mission Pub Schools
- NCES district ID
- 2011640
- Math proficiency
- 38% ▼ -6.00%
- Reading proficiency
- 46% ▼ -2.00%
- Median HH income
- $64,923
- Composite
- 37.55/100
- National rank
- #4391
- State rank
- #22 of 169 in KS
Livability — Overland Park
- Score
- 80/100
- State rank
- #16
- US rank
- #1851
Category grades
Schools grade is shown separately in the Schools card above.
Census & demographics
- Census place
- Overland Park, KS
- County
- Johnson County · 574,662 people
- City population
- 180,138
- Metro
- Kansas City, MO-KS
- Population (ZIP)
- 32,917
- Household income
- $81,477
- Rent vs Own
- Severe rent burden
- 1224.0
Population outlook (Johnson County) Hauer SSP2
- Today (2025)
- 663,396 people
- By 2030
- 702,585 · +5.9%
- By 2040
- 775,386 · +16.9%
- By 2050
- 841,772 · +26.9%
- By 2075
- 994,137 · +49.9%
- By 2100
- 1,073,036 · +61.7%
Race, ethnicity, and origin ACS 2023
- Neighborhood character
- Predominantly White (74%)
- Race & ethnicity
- White 74% Hispanic / Latino 11% Two or more races 9% Black 8% Asian 2%
- Hispanic origin (detail)
- Mexican 7%
- Common ancestry
- Italian 3% Lithuanian 2% Slovak 2%
- Foreign-born
- 10% · Canada, Vietnam
- Languages at home
- 87% English-only · Spanish 6% Other Indo-European 1% Vietnamese 1%
Political lean MEDSL · Johnson
- 2024 margin
- Lean D (+8.5) · D 53.4% · R 44.9% · Other 1.8%
- 2008→2024 swing
- +17.5pp toward D · 2008: -9.0pp · 2024: 8.5pp
- All cycles
- 2024: D+8.5 2020: D+8.2 2016: R+2.7 2012: R+17.8 2008: R+9.0
Not yet ingested
- Civics
- —
Market trends
- HPI YoY
- ▼ -268.56%
- Current HPI
- 273.2798
- Rent YoY
- ▲ 5.91%
- Metro
- Kansas City, MO-KS
- State GDP YoY
- —
- F500 in state
- 0
Price history
+0.0% since first listed3 events — show timeline
- 2026-05-21 Pending — Heartland MLS as Distributed by MLS Grid
- 2026-05-05 Listed $325,000 Heartland MLS as Distributed by MLS Grid
- 2026-04-20 Coming Soon $325,000 Heartland MLS as Distributed by MLS Grid
Property tax history
+5.7%/yrLatest (2025): $2,873 · -4.2% YoY. Source: county tax records.
Cash-flow waterfall
monthlySold comps — $/sqft
last 12 mo · ≤1 miLoading sold comps…