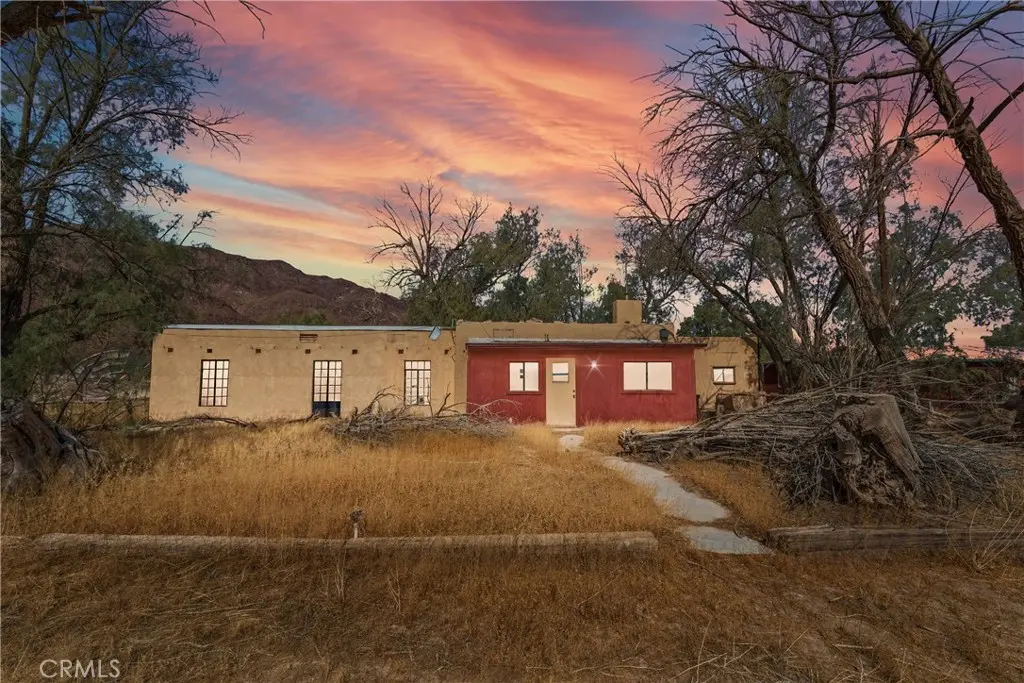
31011 Aleppo Ln
Newberry Springs, CA 92365
$185,000C-
2 bd · 1.0 ba ·
1,166 sqft ·
Built 1940
· SingleFamily
· Active
· 675 DOM
Cashflow @ list (25.0% down · 7.5%)
Estimated rent
$1,593/mo
Mortgage (P&I)
−$970
Tax + insurance
−$130
HOA
−$0
Vac / Maint / Mgmt
−$335
Net cashflow
$159/mo
Annual
$1,904/yr
Cap rate
7.32%
Cash-on-cash
3.68%
DSCR
1.16
1% rule
0.86%
Cash to close
$51,800
Investor read
- This is a 2-bed/1.0-bath single-family listed at $185k.
- At list price, monthly cash flow is $159 ($2k/yr) — positive.
- The deal already cash-flows at list — no discount required.
- To meet the 1% rule (rent ≥ 1% of price), the offer needs to be $159k (13.9% below list).
- It's been on market 675 days — a 12% lower offer ($163k) is reasonable based on typical stale-listing flexibility.
- Recommended offer: $159k (13.9% below list) — sets the bar for 1% rule.
- In year one you build about $7k of equity ($1k loan paydown + $6k appreciation (3.0% local appreciation)).
- Location reads: area grade C — affects rentability + tenant quality, not the cash-flow math above.
- Silver Valley Unified (town): math 23% / reading 39% proficiency, ranked #323 of 517 in CA (top 62%) — families likely to look elsewhere, expect single-tenant / working-renter base with shorter leases.
- Zoned schools: Yermo Elementary (math 17% / reading 27%, grade F, #1,179 of 1,571 statewide, top 78%, 340 students, 83% FRL); Fort Irwin Middle (math 23% / reading 41%, grade F, #207 of 498 statewide, top 42%, 239 students, 40% FRL); Silver Valley High (math 37% / reading 67%, grade D+, #296 of 1,170 statewide, top 27%, 369 students, 59% FRL) — zoned schools average 60% FRL vs 32% district-wide (29 pts higher); higher-poverty schools than district average — tighter screening recommended.
- Watch-outs: built in 1940 — expect roof / HVAC / electrical / plumbing capex.
- Market conditions: 211 active listings in the ZIP; 5,458 units permitted in San Bernardino County in 2024 (1,500 in 5+ unit buildings).
- San Bernardino County population projected at +15% by 2050 — modest demand growth; plan on rents tracking national, not racing it.
- 3 sale attempts since 5y ago with the ask held roughly flat each time — persistent listings suggest the price (not the market) is what's stuck; bring a comps-based counter.
- Current owner paid $50k; list at $185k implies a 270% gain — meaningful room to come down on a strong offer.
- At projected returns (3.0% appreciation + 3.0% rent growth), your $52k cash investment doubles in ~6 years — after that, you're playing with house money.
- By year 6, paydown + projected appreciation supports a ~$36k cash-out refi (75% LTV) — recoverable capital for the next deal without selling this one.
- Climate carrying-cost: extreme-heat days projected 9→25/yr by 2055 (HVAC capex compounding) — expect insurance premiums to compound above CPI over the hold.
Questions for listing agent
- It's been on market 675 days. Have you received any prior offers? Is the seller open to a 14% concession, seller financing, or rate buy-down credit?
- Built in 1940 — when were the roof, HVAC, electrical panel, plumbing, and water heater last replaced?
- Why hasn't it sold? Are there any deal-killer items the seller is aware of (foundation, flood, title, zoning, code violations)?
- Is there a deadline driving the sale (1031 exchange, divorce, estate, relocation)? That informs how much negotiation room exists.
- What's the average days-on-market for RENTAL listings here right now (not sales)? A rising rental-DOM trend means longer vacancies and softer asking-rent achievability than the comps imply.
- What's the recent tenant-quality profile in this submarket — average credit score on applications, eviction rate, late-payment / NSF rate, and stable-employment percentage? A property-management company in the area should have these aggregated.
- How much new for-sale + rental construction is in the pipeline within 1–3 miles? Heavy new supply typically softens prices + rents 12–24 months out; constrained supply supports both.
CashFlowRE · CFR-6HXXY77D74RSBJ
· Data 21 h ago
cashflowre.app · 2026-05-29